Flowchart Examples With Labels You Can Make Your Own
Adapt flowchart examples for online orders, leave requests, and login recovery with named actions, decisions, and outcomes. See reusable paths in the article.

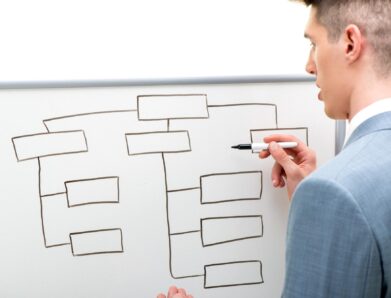
Adapt flowchart examples for online orders, leave requests, and login recovery with named actions, decisions, and outcomes. See reusable paths in the article.

What is an infographic? See how an electricity chart and appliance diagram can work together to explain a message, not just decorate it. Explore the basics.
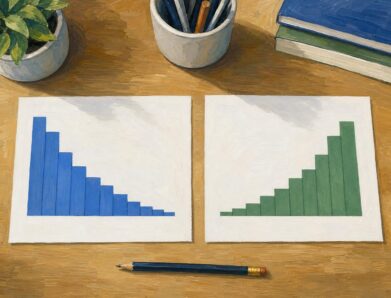
A right vs left skewed histogram is named for its tail, not its tallest bars. Avoid reversed readings and check averages and binning. Explore the guide.
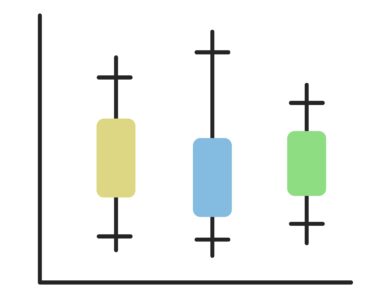
A box plot shows center and spread, not speed alone. Use task-time examples to compare medians and variability on the same scale. See the worked example.
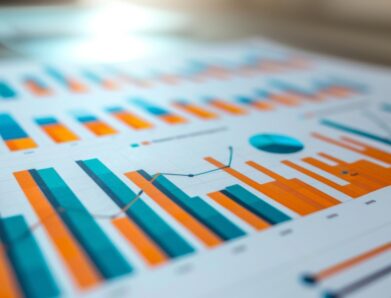
The histogram vs bar graph choice starts with categories versus numerical observations. Learn how bins and axes shape each chart, and see which fits your data.
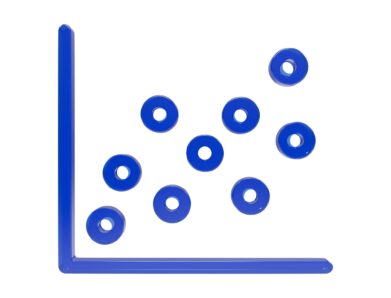
A scatter plot's slope can look persuasive while its dots tell another story. Learn to judge strength, clusters and display choices. Read the article.
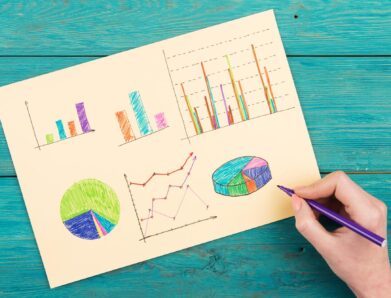
A line graph can exaggerate a modest change. Learn to check axes, read a five-month sales example and build clearer charts from your data. Explore the article.
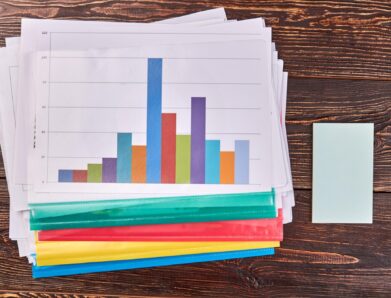
A histogram turns clinic waiting times into visible clusters and gaps. Learn what bins and bar heights mean, and how to choose bin widths. See the example.

Put 2,000 nodes and 8,000 edges on a canvas and most viewers will see spaghetti. Use layout constraints, color discipline, and geometry tuned to human perception, and clusters, bridges, and outliers become legible in under five seconds—the difference between guesswork and insight. This guide distills Design Principles for Beautiful and Readable Network Maps into practical […]

A network map with 1,200 nodes feels mesmerizing until your eyes start to swim; a five-bar chart can feel banal yet instantly graspable. The gap between awe and overload is not just taste—it’s how our visual and cognitive systems negotiate complexity, novelty, and control. If you want to use complex visuals to create connection and […]