
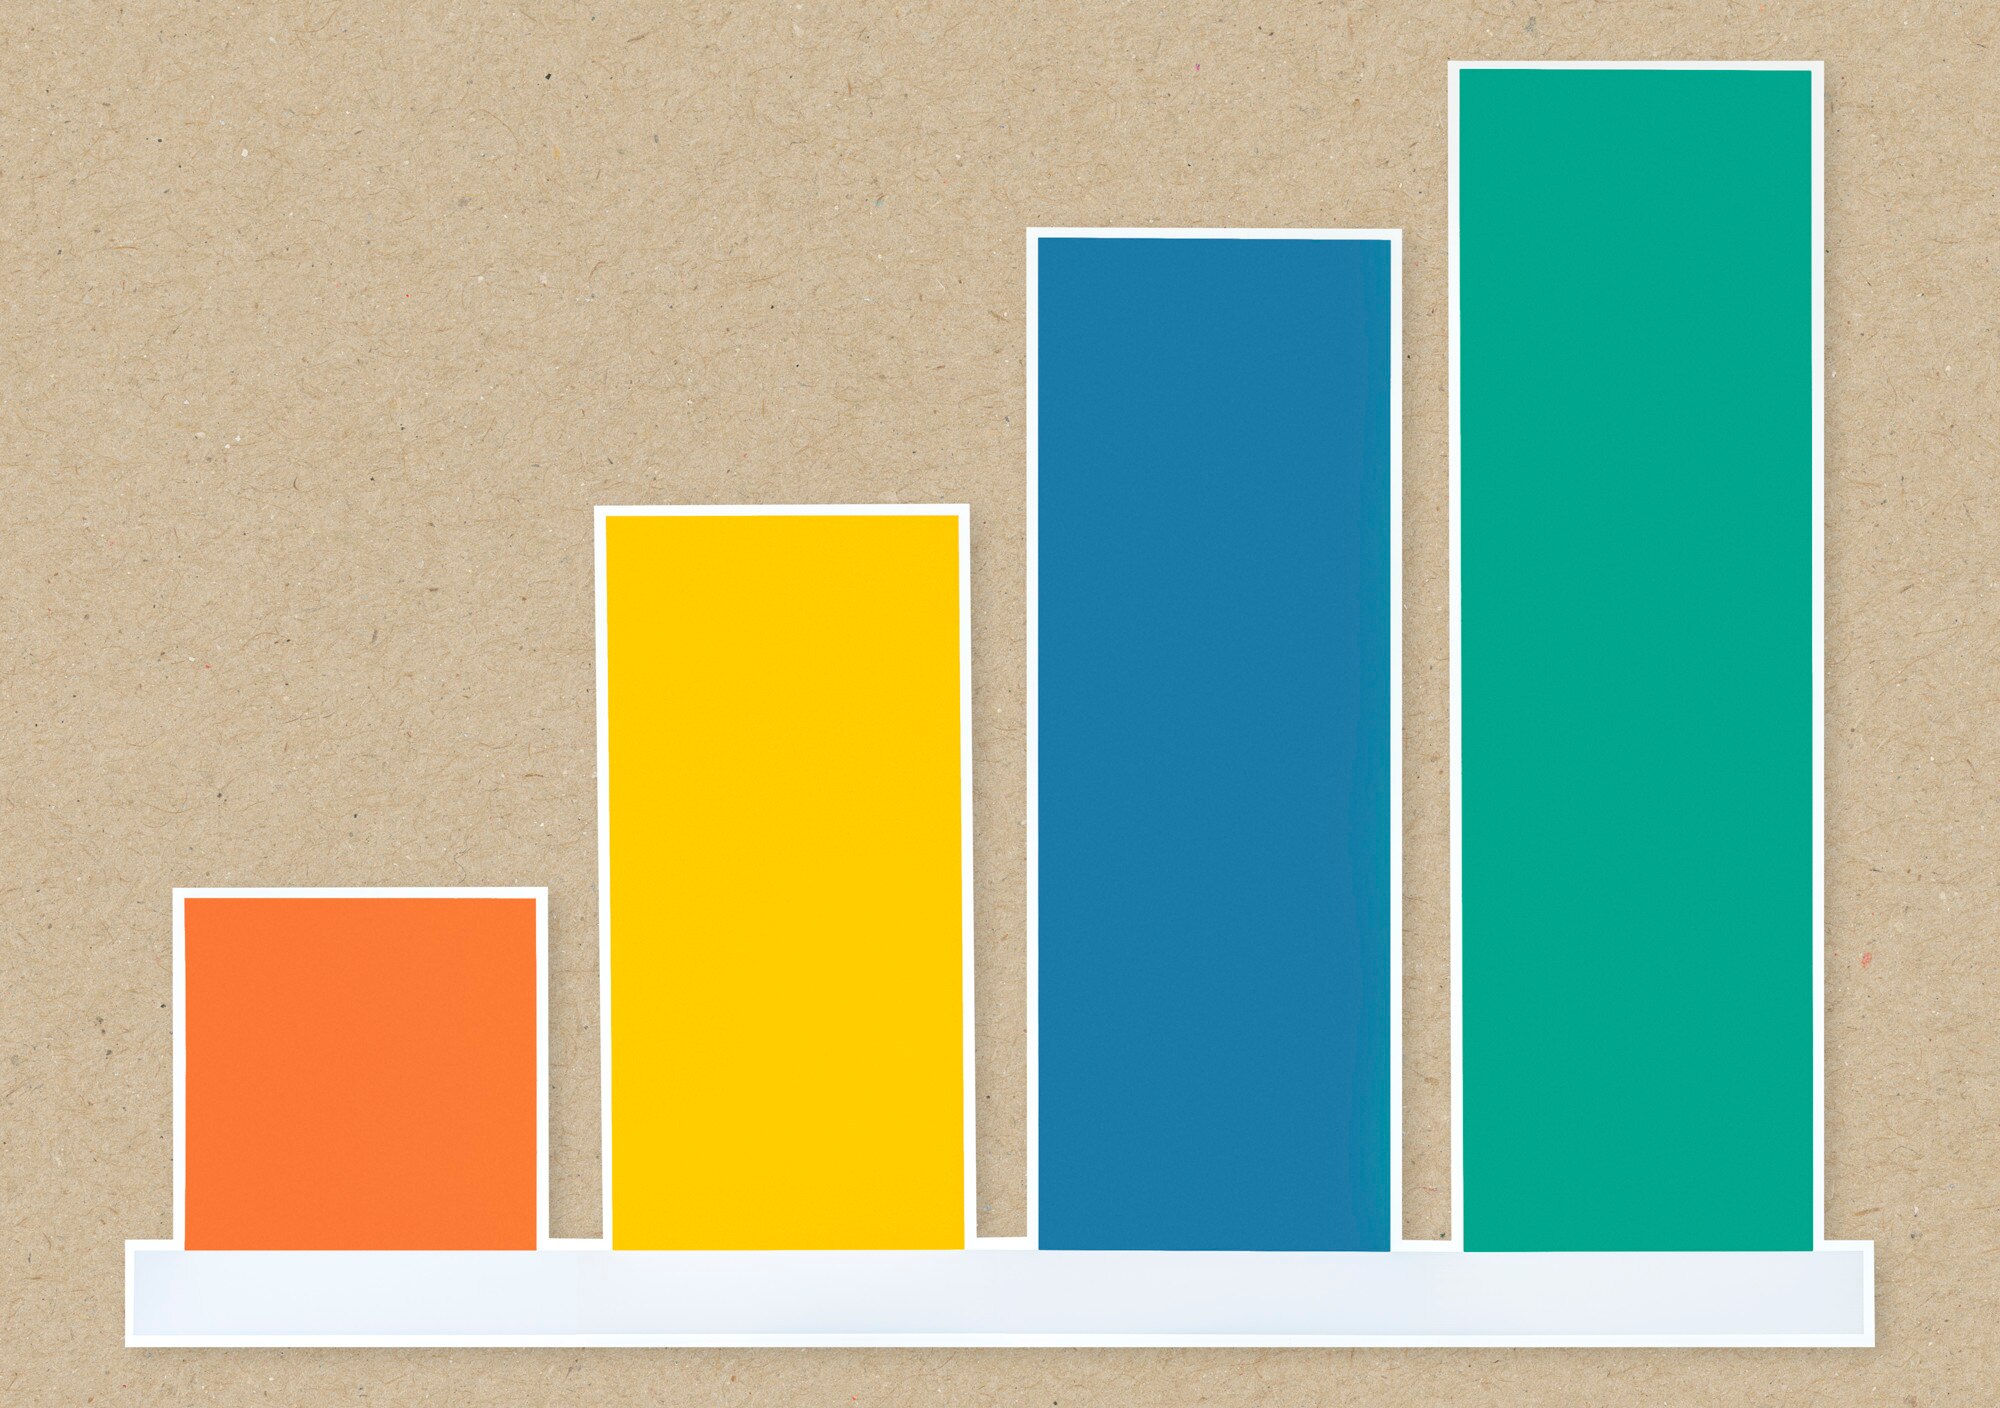

A bar graph compares categories using rectangular bars whose lengths represent numerical values. Longer bars mean larger amounts, but the scale determines whether that comparison is fair. On July 31, 2012, Fox Business’s Cavuto showed the top marginal income tax rate rising from 35% to 39.6% if the Bush tax cuts expired. Media Matters’ contemporary record reproduces the graphic, whose axis started at 34%, making the increase look enormous. This guide explains how layout and scale shape that first impression, using a small workshop table you can turn into a useful chart.
In This Article
- What a Bar Graph Shows
- Choose a Layout That Fits the Question
- Build a Bar Graph From a Small Table
- Read the Values Before Drawing Conclusions
- Know When You Need a Histogram Instead
- Keep the Comparison Easy to See
- Key Takeaways
- Frequently Asked Questions
- Choose Bars That Clarify Your Comparison
What a Bar Graph Shows
William Playfair’s The Commercial and Political Atlas, published in 1786, included a bar chart comparing Scotland’s imports and exports. Its subject was trade during the year from Christmas 1780 to Christmas 1781. Trading partners appeared as categories under “Names of Places,” with horizontal bars showing the amounts traded. The chart let readers compare trade partners without first working through a table of figures.
Those paired trade amounts gave the display a purpose beyond identifying the largest number: readers could compare imports with exports for a particular trading partner. That is still a useful test for bar graphs. What should someone compare first?
The answer determines what belongs on each axis. One axis names the categories; the other measures an amount, such as money or a count. Each bar extends from a baseline to its value, with equal numerical differences taking up equal distances. A category can also have a natural order, as satisfaction ratings do. The bar represents the quantity attached to that category, not an explanation for it.
Choose a Layout That Fits the Question
The main types of bar graphs offer different answers to that comparison question. Consider a library comparing adult and children’s program attendance across branches. Stack the two groups into one bar per branch, and total attendance becomes easy to see. Ask which branch draws more children, however, and the same arrangement becomes awkward: the children’s segments may begin at different heights.
A clustered layout fixes that problem by placing subgroup bars beside one another on a shared baseline. Readers can compare the children’s bars directly. Stacking is not wrong; it serves a different question. It shows how the groups contribute to each branch’s total, while making segments away from the baseline harder to compare.
A percentage-stacked chart changes the question again. Every complete bar represents 100%, so it emphasizes the attendance mix while concealing differences in total size. Two equally long bars could represent very different numbers of visitors.
Orientation is a separate choice. Vertical bars suit short labels, such as days of the week; horizontal bars give long department names room and make rankings easy to scan. Diverging bars serve another purpose: they extend in opposite directions from a reference, useful for favorable and unfavorable survey responses. Their labels must distinguish response groups from genuinely positive and negative numbers.
Build a Bar Graph From a Small Table
This hypothetical bar graph example records workshops offered by four community centers during one month:
| Community Center | Workshops |
|---|---|
| Cedar | 8 |
| Harbor | 12 |
| Maple | 6 |
| Union | 10 |
The alphabetical table makes a center easy to find. A chart can expose a different pattern: arrange the centers as Maple, Cedar, Union, Harbor, and the bars form an even staircase. Each center offers two more workshops than the previous one.
That pattern gives the design a job. For a ranked comparison, use that ascending order; for readers looking up a center by name, keep the table’s alphabetical order. A vertical layout fits these short names. Label the axes “Community center” and “Number of workshops,” with an evenly spaced scale from zero to 12 in increments of two.
Equal-width bars, consistent gaps, and one color are sufficient. Counts above the bars help readers retrieve exact values without estimating. A title such as “Workshops Offered by Community Center During the Sample Month” makes the period explicit without pretending this invented table describes a particular month. On graph paper or in software such as JMP, the important decision is the comparison, not the styling.
Read the Values Before Drawing Conclusions
Harbor exceeds Cedar by four workshops. Harbor also offers twice as many as Maple. The first statement is an absolute difference; the second is a ratio. Both are supported by the table, but they create different impressions of how far ahead Harbor stands.
The wording beside a chart can create a different error. Calling Harbor the “best-attended center” would turn workshop counts into an attendance claim. The table measures offerings, not participants; attendance data would answer that question. Likewise, average waiting time and total waiting hours measure different things. A percentage needs its denominator: the share of all residents is not necessarily the share of survey respondents. A caption should settle that ambiguity where it arises, not leave readers to supply their own meaning.
Know When You Need a Histogram Instead
For a shipping comparison, put company names beneath the bars and show how many packages each company handled. You could move the busiest company to the left without changing what any bar means. That is a categorical comparison, the job bar charts do.
Now put individual package weights into consecutive ranges. The question becomes whether shipments cluster at lighter weights or spread toward heavier ones. A histogram shows that distribution. Moving the busiest weight range to the left would scramble the numerical sequence and destroy the shape you wanted to examine.
That difference explains the familiar visual contrast: categorical bars usually have gaps, while histogram bars adjoin because neighboring intervals share boundaries. The gaps are a clue, not the definition. In a histogram, area represents frequency. Equal-width intervals let height carry the comparison directly; unequal widths require adjusted heights so that a wider interval does not gain misleading visual weight. Read what the axis represents before deciding which display you need.
Keep the Comparison Easy to See
The tax graphic’s baseline makes its distortion concrete. Starting at 34 leaves a visible length of one percentage point for the lower bar and 5.6 points for the higher one. One bar therefore looks more than five times as long. The actual increase is 4.6 percentage points, or about 13% relative to the original rate. The rates shown in the Fox Business graphic do not imply a fivefold increase.
This is why a zero baseline matters for bars: length is the measure. If your purpose is to show small differences within a narrow numerical range, a dot plot can focus on positions without presenting shortened bars as whole quantities.
The baseline cannot solve every reading problem. Preserve meaningful sequences, such as Monday through Sunday or ordered ratings. For unrelated categories, ranking emphasizes size; alphabetical order supports lookup, as the workshop table demonstrates.
Labels need room, too. Horizontal bars can save long names from cramped or rotated text. Light gridlines keep the values prominent; three-dimensional effects compete with them. When color distinguishes subgroups, direct labels or patterns provide another way to identify those groups.
Monthly totals bring one further constraint: preserve chronological order and mark missing periods. A missing observation is not a recorded zero. Bars suit separate period totals; a line chart often makes a sustained trend easier to follow.
Key Takeaways
- Choose the layout for the comparison readers need, not for visual variety.
- Treat totals, subgroup values, and percentage shares as different questions.
- Use the workshop table to distinguish a numerical difference from a ratio.
- Let the measured variable decide whether categories or histogram intervals belong on the axis.
Frequently Asked Questions
These answers address common choices when a chart is being labeled or redesigned.
What is a bar graph?
A bar graph compares numerical values across categories through rectangular bar lengths. If your categories are survey responses, label whether the bars count responses or show percentages; those are different readings of the same categories.
Can a bar graph show negative values?
Yes. Use zero as the baseline, with positive and negative values extending in opposite directions. Label the numerical scale clearly: bars placed on opposite sides to distinguish survey response groups do not necessarily represent positive and negative quantities.
Which axis shows categories in a horizontal layout?
The vertical axis shows categories in a horizontal layout. This orientation is useful when long names would otherwise force tiny type or tilted labels; the numerical scale runs horizontally.
When should you choose clustered rather than stacked bars?
Choose clustered bars when readers need to compare individual subgroups across categories. In the library example, that means comparing children’s attendance across branches; stacking suits a question about each branch’s total and composition.
Can bars show changes over time?
Yes, bars can compare values for distinct periods, such as quarterly sales totals. Keep the periods in sequence, and consider a line chart if following the trend matters more than comparing separate totals.
Why can a truncated value axis exaggerate differences?
A truncated value axis exaggerates differences by removing the shared lower portion of the bars, changing their apparent proportions. Tick labels may disclose the shortened scale, but readers still encounter the unequal visible lengths first.
Choose Bars That Clarify Your Comparison
Before publishing, read the chart’s title as a claim and check it against the data. Then check the display: do bars start at zero, are units and periods explicit, and does the category order support the intended comparison? For grouped or stacked bars, confirm that readers can identify each subgroup without relying on color alone. Finally, compare the visible proportions with the printed values: they should tell the same story.
Recommended for you

Reading as Mental Design: How Books Shape the Way We Think
Flip open a book and you trigger a design studio in your head: eyes fixate for roughly 200–250 ms per word group, 10–15% of eye movements jump backward to verify links, and your working memory holds about four “chunks” while you assemble a model of what the text describes. Reading as a Form of Mental […]
Bubble Chart Accuracy: Why Area Matters More Than Radius
A bubble chart can turn a fourfold rise into a sixteenfold area. Learn to read axes and size, avoid misleading circles, and choose a design. See the guide.

Venn Diagram: Why Club Rosters Can Count Students Twice
A Venn diagram explains how 18 art-club and 14 music-club members fit in a class of 30. Learn to read overlaps and avoid double counting. See how it works.

How to become productive
You can’t outwork a broken system. Knowledge workers routinely lose 60–120 minutes a day to context switching, unclear priorities, and manual tasks that smart tools could finish in seconds. The fix is not more hours; it’s a compact operating system that aligns focus, energy, and technology. If your intent is to learn how to become […]
Exponential Graph: Fixed Multipliers, Curved Results
An exponential graph multiplies outputs at equal input steps. Use points and the y=0 asymptote to sketch growth and decay curves. See the plotting steps.

How to Make an Infographic: A Worked Canva Example
Learn how to make an infographic in Canva, from a clear brief to a readable design, using a fictional maintenance log. Follow the step-by-step walkthrough.

What Is an Infographic? How Visuals Earn Their Place
What is an infographic? See how an electricity chart and appliance diagram can work together to explain a message, not just decorate it. Explore the basics.

The Visual Language of Books: How Covers Communicate Complexity
At thumbnail size—often 100–160 pixels wide on retail grids—a cover must communicate genre, tone, and complexity before a reader can zoom in. The difference between a muddled thumbnail and a crisp focal point can determine whether a title gets a click, a pickup, or a pass. If you want a practical method for turning ideas […]