
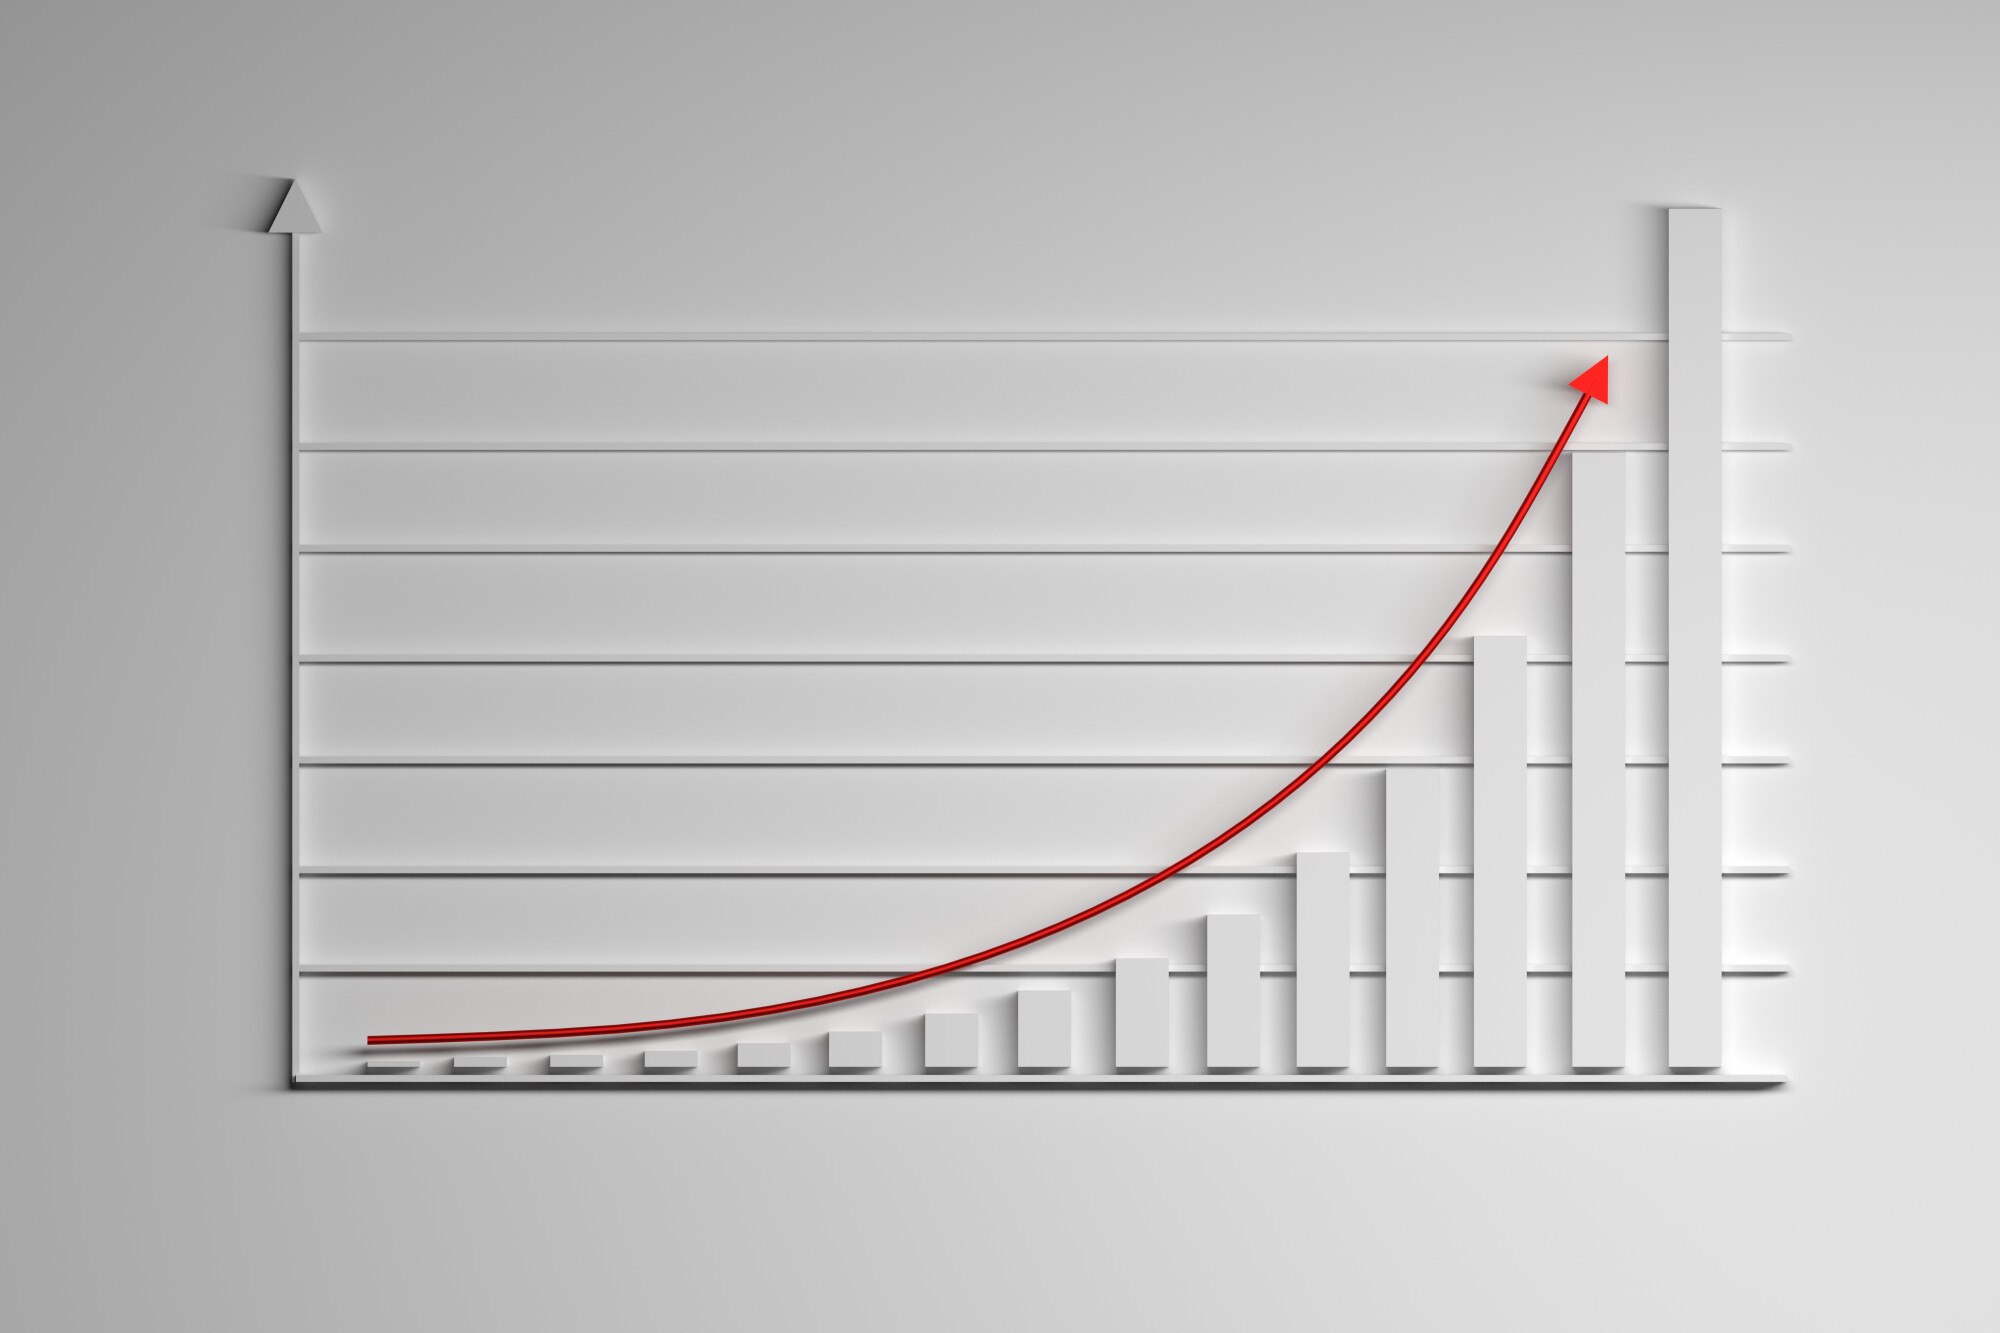

An unshifted exponential graph curves because equal input steps multiply the output by a fixed factor: doubling takes 1 to 2 to 4, so the gains keep growing. A straight line adds the same amount each step instead. To sketch the curve, use a few points and the horizontal line it approaches.
In This Article
- Recognize Growth and Decay
- Plot a Curve From Points
- Shift, Reflect, and Scale the Curve
- Find Intercepts With Logarithms
- Find an Equation From Points
- Model Percentage Change and Continuous Growth
- Key Takeaways
- Frequently Asked Questions
- Start With Points and the Asymptote
Recognize Growth and Decay
In (y=ab^x), the variable sits in the exponent, with (a\ne0), (b>0), and (b\ne1). For positive (a), a base above 1 produces an increasing curve; a base between 0 and 1 produces a decreasing one.
A negative coefficient reverses that direction: where (2^x) rises from 1 to 2, (-2^x) falls from −1 to −2. Both outputs still multiply by 2. These unshifted exponential graphs follow a fixed multiplier, not a fixed increase.
Plot a Curve From Points
For an exponential graph example, use (y=2^x). Inputs (-2,-1,0,1,2) give outputs (\frac14,\frac12,1,2,4). Plot these pairs and draw a smooth curve, not straight segments.
The exponential shape gets steeper to the right and flatter to the left. Its horizontal asymptote, (y=0), guides the left tail: the outputs stay positive even as they shrink toward zero.
Choose a plotting method according to the part you need help with:
| Plotting approach | Best for | Setup for y = 2^x | Pros | Cons |
|---|---|---|---|---|
| Hand plotting on linear graph paper | Practising coordinates | Use 1-unit ticks; x from −2 to 2, y from 0 to 4 | Shows (0, 1) and increasing steepness on equal scales | Place 1/4 and 1/2 carefully near the axis |
| Desmos Graphing Calculator | Checking a sketch | Enter y = 2^x; x-window −4 to 4, y-window −1 to 16 | Zoom and select points to inspect near y = 0 | Automatic scaling can hide small positive outputs |
| GeoGebra Graphing Calculator | Comparing curve and asymptote | Enter y = 2^x and y = 0; x from −4 to 4, y from −1 to 16 | Shows both as separate objects | Low zoom can make them appear to overlap |
| Spreadsheet XY scatter chart | Repeatable coordinate tables | Fill A2:A10 with −4 to 4; enter =2^A2 in B2 and fill down | Nine calculated points show successive doubling | Use markers; straight connectors mislead and smoothing only approximates |
Shift, Reflect, and Scale the Curve
To move the curve without guessing, use [ y=ab^{x-h}+k. ] Each parent point ((u,v)) becomes ((u+h,av+k)): (h) shifts horizontally, (a) scales vertically and reflects when negative, and (k) shifts vertically. The asymptote moves to (y=k). Each one-unit increase in (x) multiplies the signed difference (y-k) by (b), not necessarily the output (y). The domain is all real numbers; the range is (y>k) when (a>0), and (y<k) when (a<0). Applied models may restrict the domain: for example, to nonnegative elapsed time.
For (y=2\cdot2^{x-1}-3), the function simplifies to (y=2^x-3). The asymptote is (y=-3), with range (y>-3). This exponential function graph crosses the horizontal axis because the downward shift puts some outputs below zero.
Find Intercepts With Logarithms
Finding that crossing pins down where your sketch changes sign.
The (y)-intercept comes directly from (x=0): (y=2\cdot2^{-1}-3=-2), giving ((0,-2)). For the (x)-intercept, isolate the exponential: [ 0=ab^{x-h}+k \quad\Longrightarrow\quad b^{x-h}=-\frac{k}{a}. ] The right side must be positive; zero or a negative value means no real crossing. Otherwise, [ x=h+\frac{\ln(-k/a)}{\ln b}. ] Here (2^{x-1}=3/2), placing the crossing at (x=1+\log_2(3/2)\approx1.585).
Find an Equation From Points
Working backward, points ((0,y_0)) and ((1,y_1)) determine an unshifted nonconstant exponential model when (y_0) and (y_1) are nonzero, have the same sign, and differ, through [ a=y_0,\qquad b=\frac{y_1}{y_0}. ] Thus ((0,6)) and ((1,9)) give (y=6(1.5)^x). This exponential function example separates the starting output from the multiplier.
For a known asymptote (y=k), compare distances from that line: [ a=y_0-k,\qquad b=\frac{y_1-k}{y_0-k}. ] Without the asymptote, two points generally leave a vertically shifted model undetermined.
Model Percentage Change and Continuous Growth
Suppose a population starts at 200 and grows 5% annually. The model is (y=200(1.05)^x), with (x) in years. Its exponential growth graph shows larger annual gains as the population grows. In general, a positive starting amount (A) and decimal rate (p) give (y=A(1+p)^x).
Decay uses (1-p): a hypothetical sample retaining 80% each hour follows (y=A(0.8)^x).
For continuous growth, use (y=Ae^{rx}), where (A>0) and (e\approx2.71828). The natural exponential graph is (y=e^x); positive (r) gives growth and negative (r) gives decay.
Key Takeaways
- Extend a point table by multiplying outputs for an unshifted exponential, or signed differences from the asymptote for a shifted one.
- Keep the asymptote separate from the horizontal axis when a curve shifts.
- Match a percentage multiplier to the input’s time unit.
- Use intercepts to anchor where the sketch meets the axes.
Frequently Asked Questions
How Do You Tell If a Graph Is Linear or Exponential?
Equal input steps give constant output differences for a line and constant ratios for an unshifted exponential. For a shifted exponential, compare distances from its asymptote instead.
Can an Exponential Curve Touch Its Horizontal Asymptote?
No: for these nonconstant functions, (y-k=ab^{x-h}) cannot equal zero. An apparent overlap on a screen reflects the display scale, not contact.
Why Must the Base Be Positive and Different From 1?
A positive base permits every real input, while excluding 1 prevents a constant function. A negative base fails at inputs such as (x=\frac12); gaps in such a plot are not an exponential curve’s missing tail.
Can an Exponential Function Have Negative Outputs?
Yes: a negative coefficient reflects the unshifted curve across the horizontal axis. Its range becomes (y<0), instead of (y>0) for a positive coefficient; a vertical shift can also create negative outputs.
How Can You Check Plotted Points in Desmos?
Enter the equation and a table of your inputs and calculated outputs, then compare the points with the curve. Put parentheses around the entire exponent of a transformed equation to avoid plotting a different function.
Start With Points and the Asymptote
If you need a sketch, choose hand plotting to practise placing fractional outputs; choose a calculator when you need to inspect a crossing more closely. For a model, first decide what one input step represents. An hourly retention factor cannot describe a yearly step without conversion.
Once the points are in place, give the empty space between them equal attention. In the shifted example, the crossing near 1.585 belongs between outputs of opposite signs, while the tail stays above its own limiting line. Extra points can test your drawing, but they cannot rescue the wrong shape. A faithful exponential sketch preserves the fixed multiplier in signed differences from its asymptote, including where you have plotted no points at all.
Recommended for you

An ER Diagram Shows Where Each Database Fact Belongs
An ER diagram links business rules to data structure. Follow the customer-order example to see where sale prices belong and avoid design gaps. See how.
Reading a Linear Graph: Why the Slope Stays the Same
Understand a linear graph through constant slope, intercepts, and y = mx + b. Turn equations into points you can plot with confidence. See how it works.
Scatter Plot Reading: Steepness Isn’t the Whole Story
A scatter plot's slope can look persuasive while its dots tell another story. Learn to judge strength, clusters and display choices. Read the article.

Stem and Leaf Plot: Ordered Data, Every Value Visible
A stem and leaf plot keeps each value visible while sorting reading times into rows. Learn to build one, find the middle, and spot patterns. See how it works.

Basics: What Is a Heat Map? Why the Legend Matters
What is a heat map? Learn how colors represent values, why sales dollars can be mistaken for orders, and how to read axes and legends. See the examples.

Neural Network Diagram: Labels That Explain the Output
Read a neural network diagram without confusing scores with probabilities. Learn how arrows, layers, and activation labels clarify outputs. See the article.
Explained: How to Read a Histogram, From Axes to Area
Learn how to read a histogram using book-length examples. Check axes, interpret counts, and see why unequal bin widths need area. Read the walkthrough.

Climate Change Infographic: From Emissions to Action
See how a climate change infographic links heat-trapping gases to rising heat, then separates emissions cuts from adaptation. Explore the causes and actions.