Mapped: How a Bill Becomes a Law Flowchart—Key Decisions
Use this how a bill becomes a law flowchart to trace committee review, chamber votes and presidential action. See why bills move forward or stop along the way.

Use this how a bill becomes a law flowchart to trace committee review, chamber votes and presidential action. See why bills move forward or stop along the way.
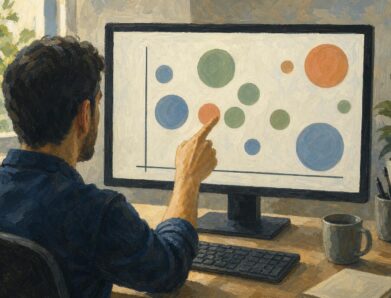
A bubble chart can turn a fourfold rise into a sixteenfold area. Learn to read axes and size, avoid misleading circles, and choose a design. See the guide.
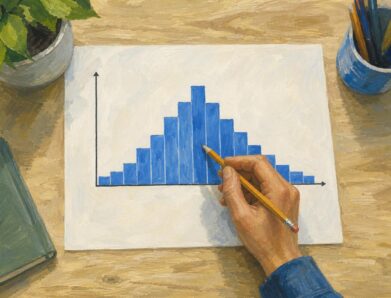
A symmetric histogram mirrors bars around a center, not always its tallest peak. Compare tails and see how bin boundaries affect balance. Read the example.
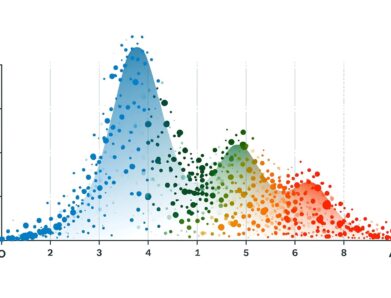
A bimodal histogram can reveal two operating conditions. Use the 15 and 25 millisecond test example to read the peaks and plan your next analysis. See how.

Find infographic ideas for report findings, customer questions, budgets, and more. Match each question to a clear visual structure—explore the examples.
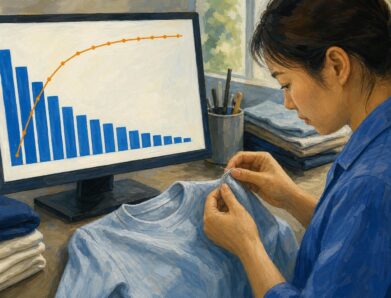
Read a pareto chart’s bars and cumulative line, calculate category shares, and build one in Excel with a clothing-defect example. See how priorities take shape.

Learn how to make an infographic in Canva, from a clear brief to a readable design, using a fictional maintenance log. Follow the step-by-step walkthrough.
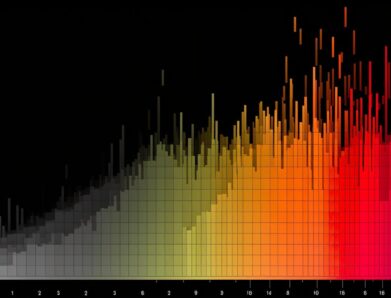
A frequency histogram shows how common scores are, not how high. Check interval boundaries, trace bars to scores, and avoid misreading the chart. See how.

A stem and leaf plot keeps each value visible while sorting reading times into rows. Learn to build one, find the middle, and spot patterns. See how it works.

Adapt flowchart examples for online orders, leave requests, and login recovery with named actions, decisions, and outcomes. See reusable paths in the article.