15 Venn Diagram Examples: Shared vs. Exclusive Members
Venn diagram examples clarify shared and exclusive members, from fruit baskets to an 80-person pet survey. Avoid double-counting; explore all 15 examples.


Venn diagram examples clarify shared and exclusive members, from fruit baskets to an 80-person pet survey. Avoid double-counting; explore all 15 examples.

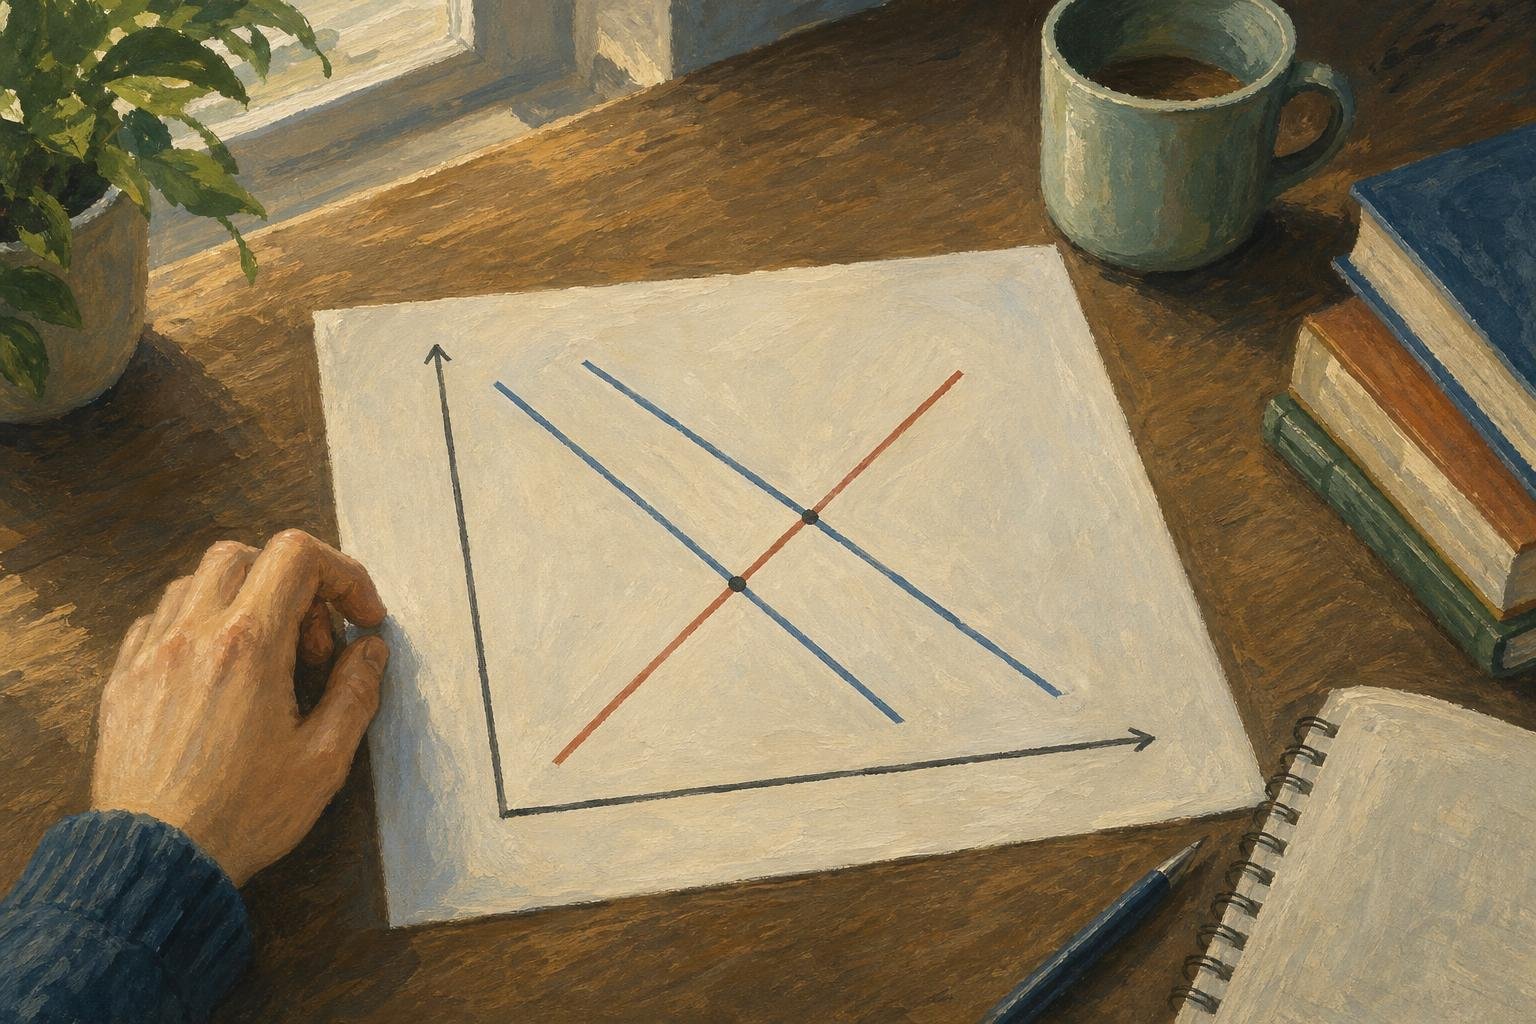
A loanable funds graph shows why weaker investment demand can lower interest rates. Distinguish curve shifts from movements and trace the cause. See how.

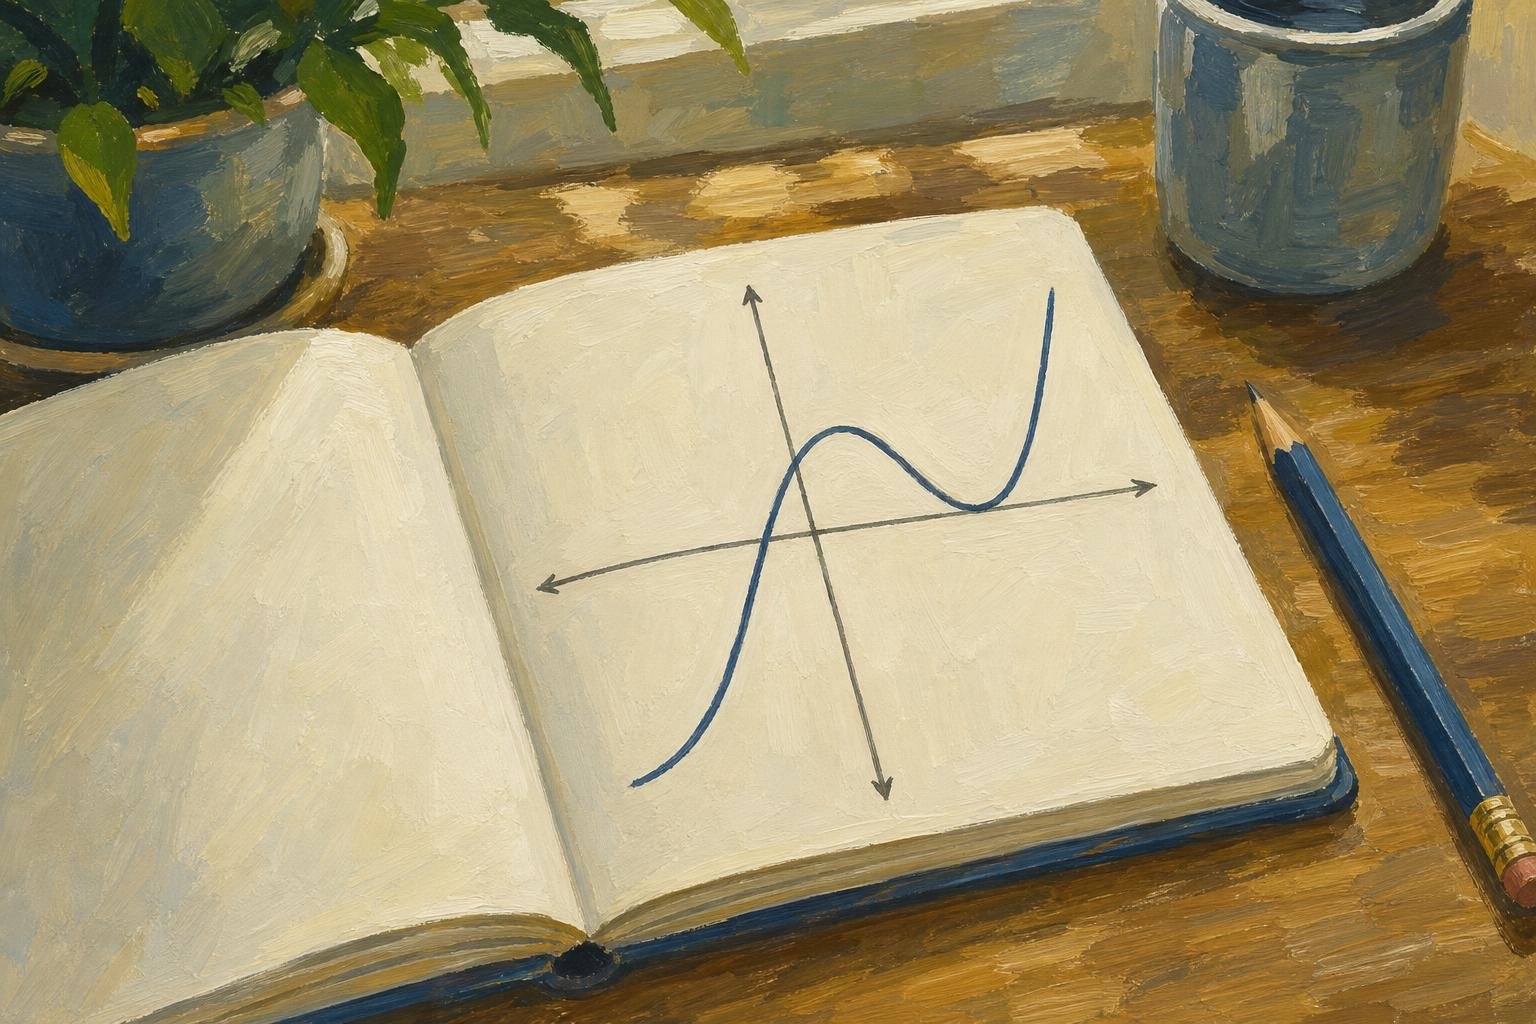
Learn why a cubic graph can flatten without turning, then use intercepts and transformations to sketch its shape and read solutions. See the worked sketch.

Use a residual plot to spot patterns in regression errors. Follow a lemonade stand's $5 error from calculation to model checks. See how to interpret the signs.

A violin plot can reveal different bill patterns behind the same median. Learn how shape, points, and smoothing affect comparisons. See the restaurant example.
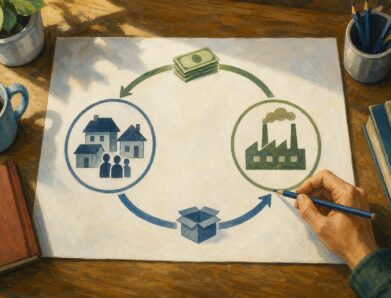
A circular flow diagram connects a $4 bread purchase to work and income. Learn how goods and money move through two markets. Follow the example in the article.

A logarithmic graph spaces 10–100 like 100–1,000. Separate log axes from log functions, read values, and plot curves with confidence. See how it works.

What is a diagram? Learn how labeled shapes and connecting lines explain relationships, how diagrams differ from drawings, and how to read one. Read on.

An ER diagram links business rules to data structure. Follow the customer-order example to see where sale prices belong and avoid design gaps. See how.
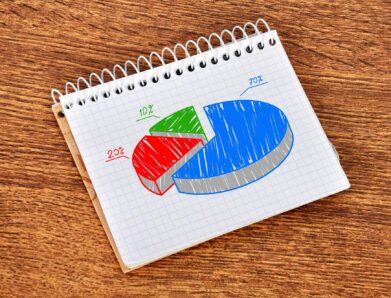
Read a circle graph without mistaking the largest slice for a majority. Follow a 40-student survey from counts to percentages and angles. See how it works.