
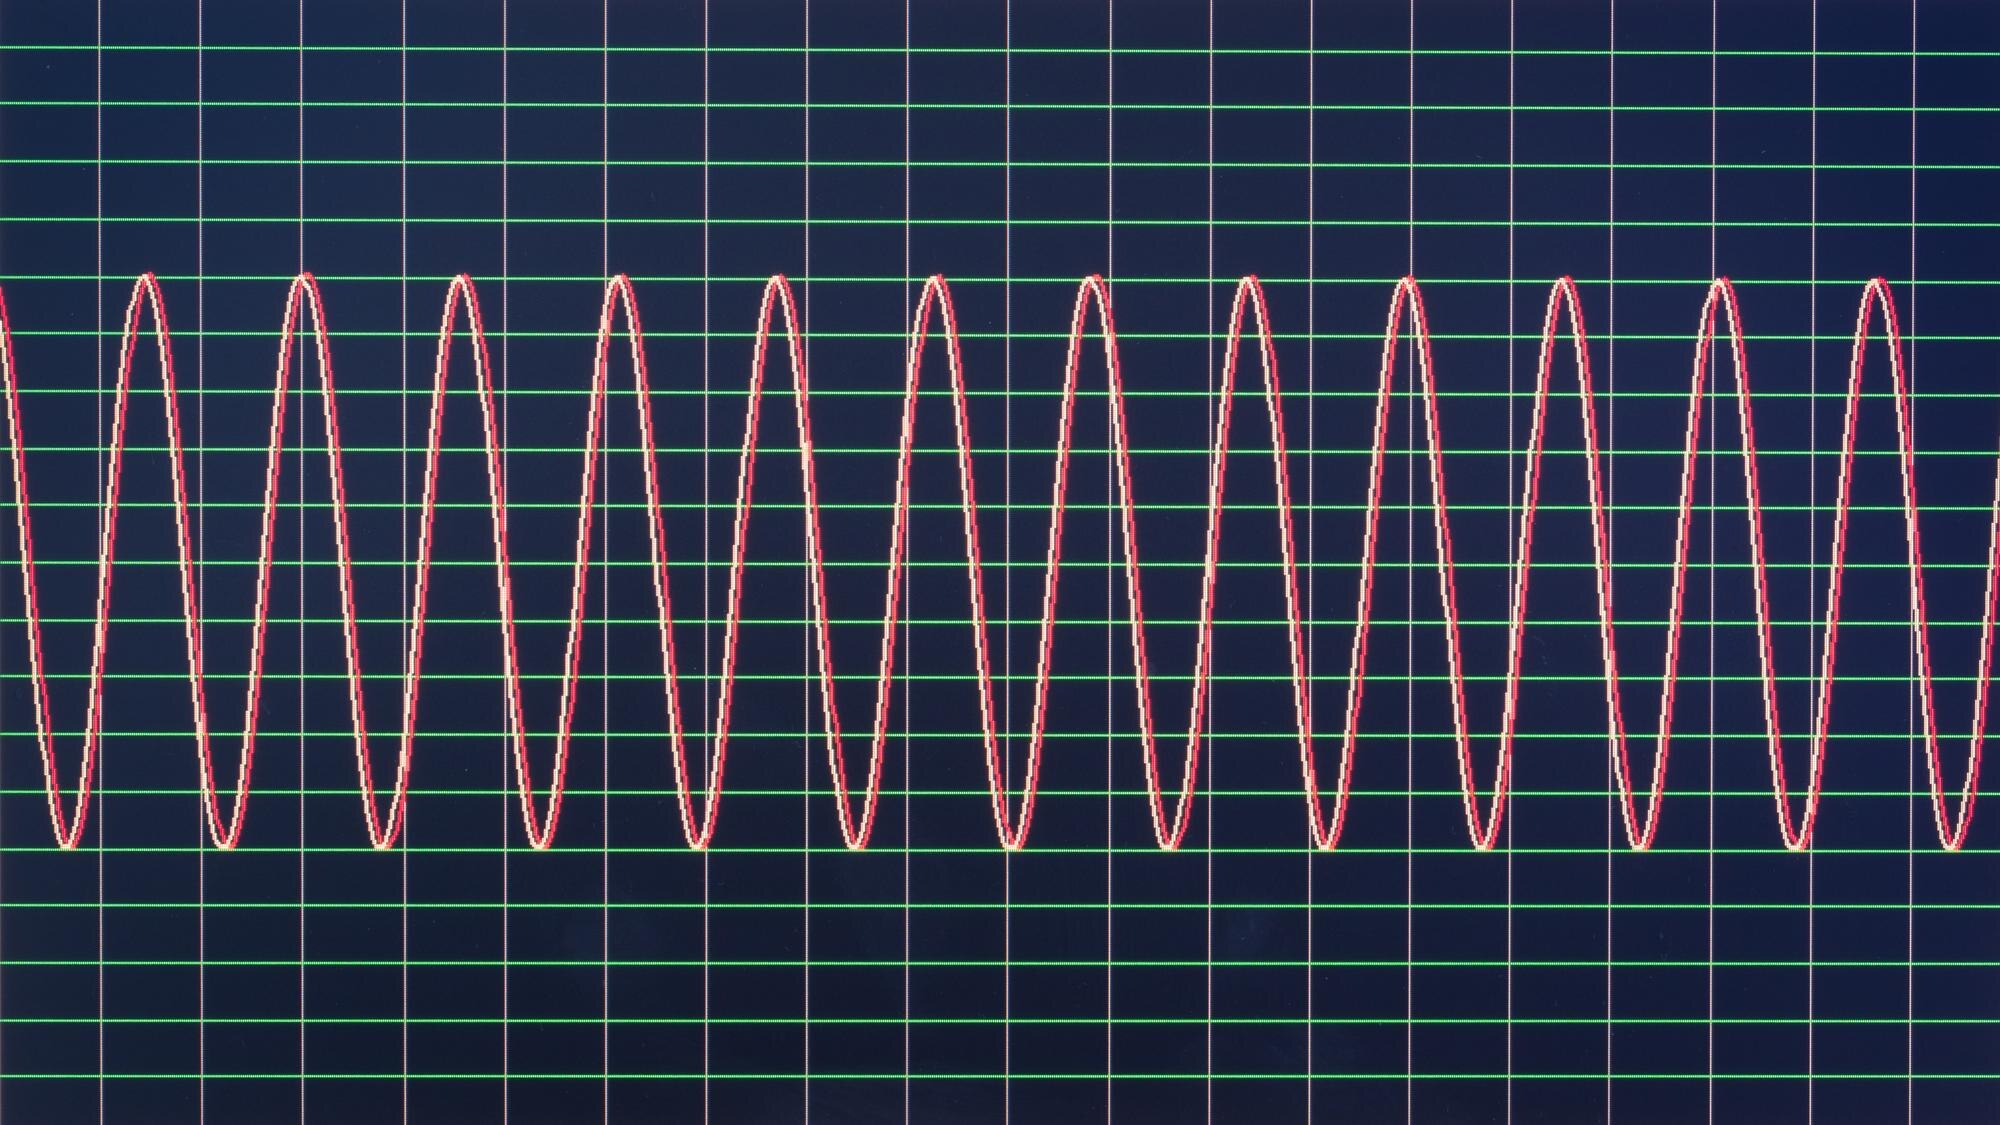

A sin graph traces the height of a point traveling around a circle as its angle increases. For a circle of radius 1, that height is (\sin x): one full turn draws one repeating wave. The horizontal axis records the angle traveled, not the point’s sideways position on the circle.
That connection lets you draw a sine graph from known points instead of guessing a wave. We’ll use it to build one cycle, reshape it, and read an equation from a finished graph. Throughout, the useful pattern is a midline crossing, two turning points separated by another crossing, and a return to the starting height and direction. Unless a degree symbol appears, angles are in radians.
In This Article
- Understand What the Axes Show
- Connect Sine Values to the Unit Circle
- Sketch One Cycle With Five Points
- Find Amplitude, Period, and Shifts
- Work Through a Transformed Graph
- Extend the Curve and Model Motion
- Check Your Graph and Read Equations Back
- Key Takeaways
- Frequently Asked Questions
- Build Each Cycle From Known Points
Understand What the Axes Show
On (y=\sin x), a point such as ((\pi/6,1/2)) pairs an input angle with an output height. It says, “At an angle of (\pi/6), the height is (1/2).” It does not say that the height is half a radian. Writing ((\pi/6,1/2\text{ rad})) would give the vertical coordinate units it does not have.
Those different roles matter when you label the axes. Along the horizontal axis, one complete turn can be marked as (360^\circ) or (2\pi) radians. These labels describe the same rotation using different units; changing between them does not change the heights.
On a sin x graph, (\pi/2) and (\pi) are exact input locations, not decimal estimates. The number π connects a circle’s circumference to its diameter, which is why it appears naturally when angles describe travel around a circle. Keep the horizontal labels in one unit system so that equal distances on the page represent equal changes in angle.
Connect Sine Values to the Unit Circle
The unit circle has radius 1 and center ((0,0)). An angle measured counterclockwise from the positive horizontal axis reaches the point ((\cos x,\sin x)). The sine function graph takes that point’s vertical coordinate and plots it against the angle.
As the point approaches the top of the circle, its rise slows. At the top, it stops rising and begins falling, even though its travel around the circle continues. That change creates the rounded peak of the graph. A rider carried around the circle would pass through the same change in vertical motion: upward travel gives way to downward travel without a corner.
The lower half supplies the trough. Heights there are negative, while the leftmost and rightmost points have height zero. Because the circle reaches only one radius above and below its center, its sine values stay between (-1) and 1.
The table follows the moving point through a full turn. Read its behavior column as a continuous journey, with each midpoint showing what happens between a crossing and a turning point.
Sin graph plotting points from one full unit-circle rotation
| Rotation position | Angle θ (radians; degrees) | Unit-circle point (cos θ, sin θ) | Sine graph point (θ, sin θ) | Sine graph behavior |
|---|---|---|---|---|
| Start: positive horizontal axis | 0; 0° | (1, 0) | (0, 0) | Crosses zero upward |
| Quadrant I midpoint | π/4; 45° | (√2/2, √2/2) | (π/4, √2/2) | Positive and rising |
| Quarter turn: top of circle | π/2; 90° | (0, 1) | (π/2, 1) | Maximum: y = 1; turns downward |
| Quadrant II midpoint | 3π/4; 135° | (−√2/2, √2/2) | (3π/4, √2/2) | Positive and falling |
| Half turn: negative horizontal axis | π; 180° | (−1, 0) | (π, 0) | Crosses zero downward |
| Quadrant III midpoint | 5π/4; 225° | (−√2/2, −√2/2) | (5π/4, −√2/2) | Negative and falling |
| Three-quarter turn: bottom of circle | 3π/2; 270° | (0, −1) | (3π/2, −1) | Minimum: y = −1; turns upward |
| Quadrant IV midpoint | 7π/4; 315° | (√2/2, −√2/2) | (7π/4, −√2/2) | Negative and rising |
| Full turn: back to start | 2π; 360° | (1, 0) | (2π, 0) | Crosses zero upward; cycle repeats |
Sketch One Cycle With Five Points
The table’s crossings and turning points give five anchors for the basic sine curve: ((0,0)), ((\pi/2,1)), ((\pi,0)), ((3\pi/2,-1)), and ((2\pi,0)). Space their inputs evenly. Each step covers a quarter-turn, so the horizontal gaps must match even though the heights change direction.
Now consider the first gap. Sine is already at (1/2) at (x=\pi/6). The curve rises above the straight segment from ((0,0)) to ((\pi/2,1)), then eases toward its peak; joining the anchors with a ruler misses that changing slope.
Two more exact values help shape the rise: (\sin(\pi/4)=\sqrt{2}/2) and (\sin(\pi/3)=\sqrt{3}/2). Draw through these heights with a smooth bend that flattens at the maximum. Carry the same rounded movement through the trough, allowing the curve to pass through each zero without flattening.
The final zero completes the cycle because it restores the initial direction as well as the initial height. The middle zero restores the starting height, but the curve crosses downward rather than upward. A full cycle returns the motion to where it began.
Find Amplitude, Period, and Shifts
Use the five-point curve you sketched to follow changes to its equation. Multiplying (\sin x) by 2 pulls its peaks and troughs twice as far from the horizontal axis. Adding 1 then lifts the whole curve, making (y=1) its midline. The shape remains recognizable; its vertical reference has moved.
These changes fit the general form
[ y=A\sin\bigl(B(x-C)\bigr)+D. ]
The distance from the midline to either extreme is the amplitude, (|A|). With midline (y=D), the extremes are (D+|A|) and (D-|A|). Making (A) negative flips the vertical displacement across that midline: the first rise becomes a fall, but the amplitude stays positive.
Now squeeze the curve horizontally. Increasing (|B|) makes the inside angle advance faster, so a full wave fits into less horizontal space. Its period is
[ P=\frac{2\pi}{|B|}, ]
or (360^\circ/|B|) for degree inputs. These oscillating-curve rules assume (A\ne0) and (B\ne0); either zero makes the function constant.
Finally, slide the squeezed curve sideways. In this factored form, (C) moves the reference crossing right when positive and left when negative. For example, (\sin(3x-\pi)=\sin(3(x-\pi/3))), so the shift is (\pi/3), not (\pi). For a sin function graph, the grouping inside the parentheses determines where the cycle begins.
If (B) is negative, use (\sin(-u)=-\sin u) to move that sign outside first. With a positive inside multiplier, you can read the transformed curve from left to right using the same five-anchor pattern.
Work Through a Transformed Graph
Consider the curve
[ y=-2\sin\left(2\left(x-\frac{\pi}{4}\right)\right)+1. ]
Its reference crossing is ((\pi/4,1)), but the curve heads down from there. The negative outside coefficient sends it toward the trough first. A sketch that rises from this crossing would have the right starting point and the wrong motion.
The period is (\pi), so each quarter-step spans (\pi/4). From the reference crossing, the five anchors are
[ \left(\frac\pi4,1\right),\quad \left(\frac\pi2,-1\right),\quad \left(\frac{3\pi}4,1\right),\quad (\pi,3),\quad \left(\frac{5\pi}4,1\right). ]
The curve drops to (-1), turns upward through its midline, and reaches 3 before returning. Its amplitude is 2 about (y=1), so the range is ([-1,3]). The horizontal squeeze makes that entire movement happen within half the basic curve’s period.
Substitution gives a compact check on the first turn: at (x=\pi/2), the inside angle is (\pi/2), making the output (-1). At the last anchor, the inside angle reaches (2\pi), restoring the midline height. Just beyond it, the curve heads downward again. Both position and direction close the cycle.
Extend the Curve and Model Motion
A completed cycle supplies the rest of the graph. Add or subtract its period from any horizontal coordinate and keep the same height. Negative inputs belong to that continuation: for the basic function, (\sin(-x)=-\sin x), so (\sin(-\pi/6)=-1/2). This is half-turn symmetry about the origin, not a reflection across the vertical axis.
That repetition also measures how much motion an interval contains. Divide its width by the period, regardless of where the interval begins. The transformed example covers two cycles within a width of (2\pi), even if neither endpoint is a crossing.
A sin curve can turn those horizontal inputs into time. Take an idealized Ferris wheel with an approximately 82-foot diameter, a boarding height of approximately 3.3 feet, and a 10-minute revolution at constant rotational speed.
Place the rider at the lowest point initially. Using those approximate dimensions, the radius is 41 feet and the midline height is (41+3.3=44.3) feet. The period is 10 minutes, giving the following sine model.
[ h(t)=44.3+41\sin\left(\frac{\pi}{5}(t-2.5)\right), ]
where (t) is minutes after boarding and (h(t)) is height in feet. The shift of 2.5 minutes places the upward midline crossing a quarter-revolution after boarding.
Plot the five anchors ((0,3.3)), ((2.5,44.3)), ((5,85.3)), ((7.5,44.3)), and ((10,3.3)). The rider starts at boarding height, reaches the peak after 5 minutes, and returns to boarding height after 10 minutes.
Check Your Graph and Read Equations Back
Reading a graph backward begins with its extremes. Suppose the maximum is 7 and the minimum is (-1). The midline lies halfway between them at 3, while the amplitude is half their separation, or 4. These measurements establish the vertical structure without locating a single crossing.
Suppose a full cycle spans 12 horizontal units. The inside angle must then complete its turn over that distance, giving (B=2\pi/12=\pi/6). Yet the curve could still slide horizontally without changing any of those measurements. Something is missing: its position.
An upward midline crossing at (x=2) supplies that missing clue. One matching equation is
[ y=4\sin\left(\frac\pi6(x-2)\right)+3. ]
The upward direction selects a positive sine cycle; the crossing’s location fixes its shift. A peak would also locate the wave, but it marks a quarter-cycle after that reference crossing, not the crossing itself.
A different-looking equation may still describe this exact graph. Moving the phase shift by a whole period leaves every height unchanged, and changing the outside sign can be offset by a half-period shift. To compare two candidates, use a turning point and the direction of a midline crossing. Those clues distinguish a shifted match from a reflected mismatch.
Key Takeaways
- Read a plotted point as an input angle paired with a height; the two coordinates do different jobs.
- Use the table’s crossings and turning points as anchors, then use intermediate values to shape the bends.
- A cycle ends when both height and direction return, not at the first repeated height.
- Factor the inside expression before assigning a phase shift.
- When recovering an equation, extremes and period establish its size; a located crossing establishes its placement.
Frequently Asked Questions
How can you find a sine equation from its maximum, minimum, and period?
Those measurements give the amplitude, midline, and horizontal multiplier, but you need a horizontal reference to fix the shift. Half the maximum-minus-minimum difference gives (A), their average gives (D), and (B=2\pi/P) for radian coordinates. The example with extremes 7 and (-1) remains free to slide until its upward crossing at (x=2) pins it down.
Why does a calculator give an unexpected value for sin(90)?
The calculator may be reading 90 as radians instead of degrees. In degree mode, (\sin(90^\circ)=1). Match the mode to the angle’s units before evaluating it.
How do you locate the five key points after a phase shift?
For positive (B), use inputs (C,C+P/4,C+P/2,C+3P/4,C+P) and heights (D,D+A,D,D-A,D). In the worked example, the first step from (\pi/4) to (\pi/2) takes the height from 1 down to (-1). If (B) is negative, transfer its sign outside using sine’s odd symmetry first.
What changes when the coefficient of sine is negative?
A negative outside coefficient reflects the curve across its midline, swapping upper and lower turning points at the same inputs. Its absolute value still gives the amplitude. In the worked example, that sign makes the reference crossing lead into the trough instead of the peak.
How can you tell whether a displayed interval contains one cycle or two?
Divide the interval’s horizontal width by the period: 1 means one cycle, and 2 means two. For a visual check, follow successive upward midline crossings. Successive midline crossings are half a period apart; crossings in the same direction are one period apart. Zeros are not a reliable guide when the graph is shifted vertically.
Why must sine’s domain be restricted before defining its inverse?
Sine needs a restricted domain because its repeated outputs otherwise give more than one possible input angle. On ([-\pi/2,\pi/2]), it is one-to-one and still covers the full range ([-1,1]). Its inverse, (\arcsin), therefore returns one principal angle for each allowed input.
Build Each Cycle From Known Points
If you need a quick sketch, put your effort into locating the reference crossing and deciding which way the curve leaves it. Those choices organize everything that follows. For a more precise drawing, add an intermediate value between anchors; sine’s height of one-half at pi over six helps shape the bend.
If you are reading a finished graph, reverse the task: use its extremes to establish the midline, then find a crossing with a clear direction. The essential idea is that sine records circular height against advancing angle. A convincing graph preserves that relationship, not merely the appearance of a wave.
Recommended for you

Turning Data into Stories: The Psychology of Visual Complexity
A network map with 1,200 nodes feels mesmerizing until your eyes start to swim; a five-bar chart can feel banal yet instantly graspable. The gap between awe and overload is not just taste—it’s how our visual and cognitive systems negotiate complexity, novelty, and control. If you want to use complex visuals to create connection and […]

Area Chart Fill: Separate Values or a Shared Total?
An area chart uses fill to emphasize magnitude, but stacked and separate values mean different things. See the distinctions and learn how to build one in Excel.

Deep Reading in a Digital World: Stay Focused in an Age of Distraction
Your attention is outnumbered: surveys put daily phone pickups in the 50–150 range and notifications in the dozens, while a single interruption can cost several minutes to regain depth. If you want Deep Reading in a Digital World: How to Stay Focused in the Age of Distraction, you need a deliberate method, not willpower. This […]

What Is an Infographic? How Visuals Earn Their Place
What is an infographic? See how an electricity chart and appliance diagram can work together to explain a message, not just decorate it. Explore the basics.

Flowchart Examples With Labels You Can Make Your Own
Adapt flowchart examples for online orders, leave requests, and login recovery with named actions, decisions, and outcomes. See reusable paths in the article.

What Is a Diagram? Explanation, Not Just Illustration
What is a diagram? Learn how labeled shapes and connecting lines explain relationships, how diagrams differ from drawings, and how to read one. Read on.

Comparing Histogram vs Bar Graph: What Values Reveal
The histogram vs bar graph choice starts with categories versus numerical observations. Learn how bins and axes shape each chart, and see which fits your data.
Frequency Histogram: Every Bar Traced to Its Scores
A frequency histogram shows how common scores are, not how high. Check interval boundaries, trace bars to scores, and avoid misreading the chart. See how.