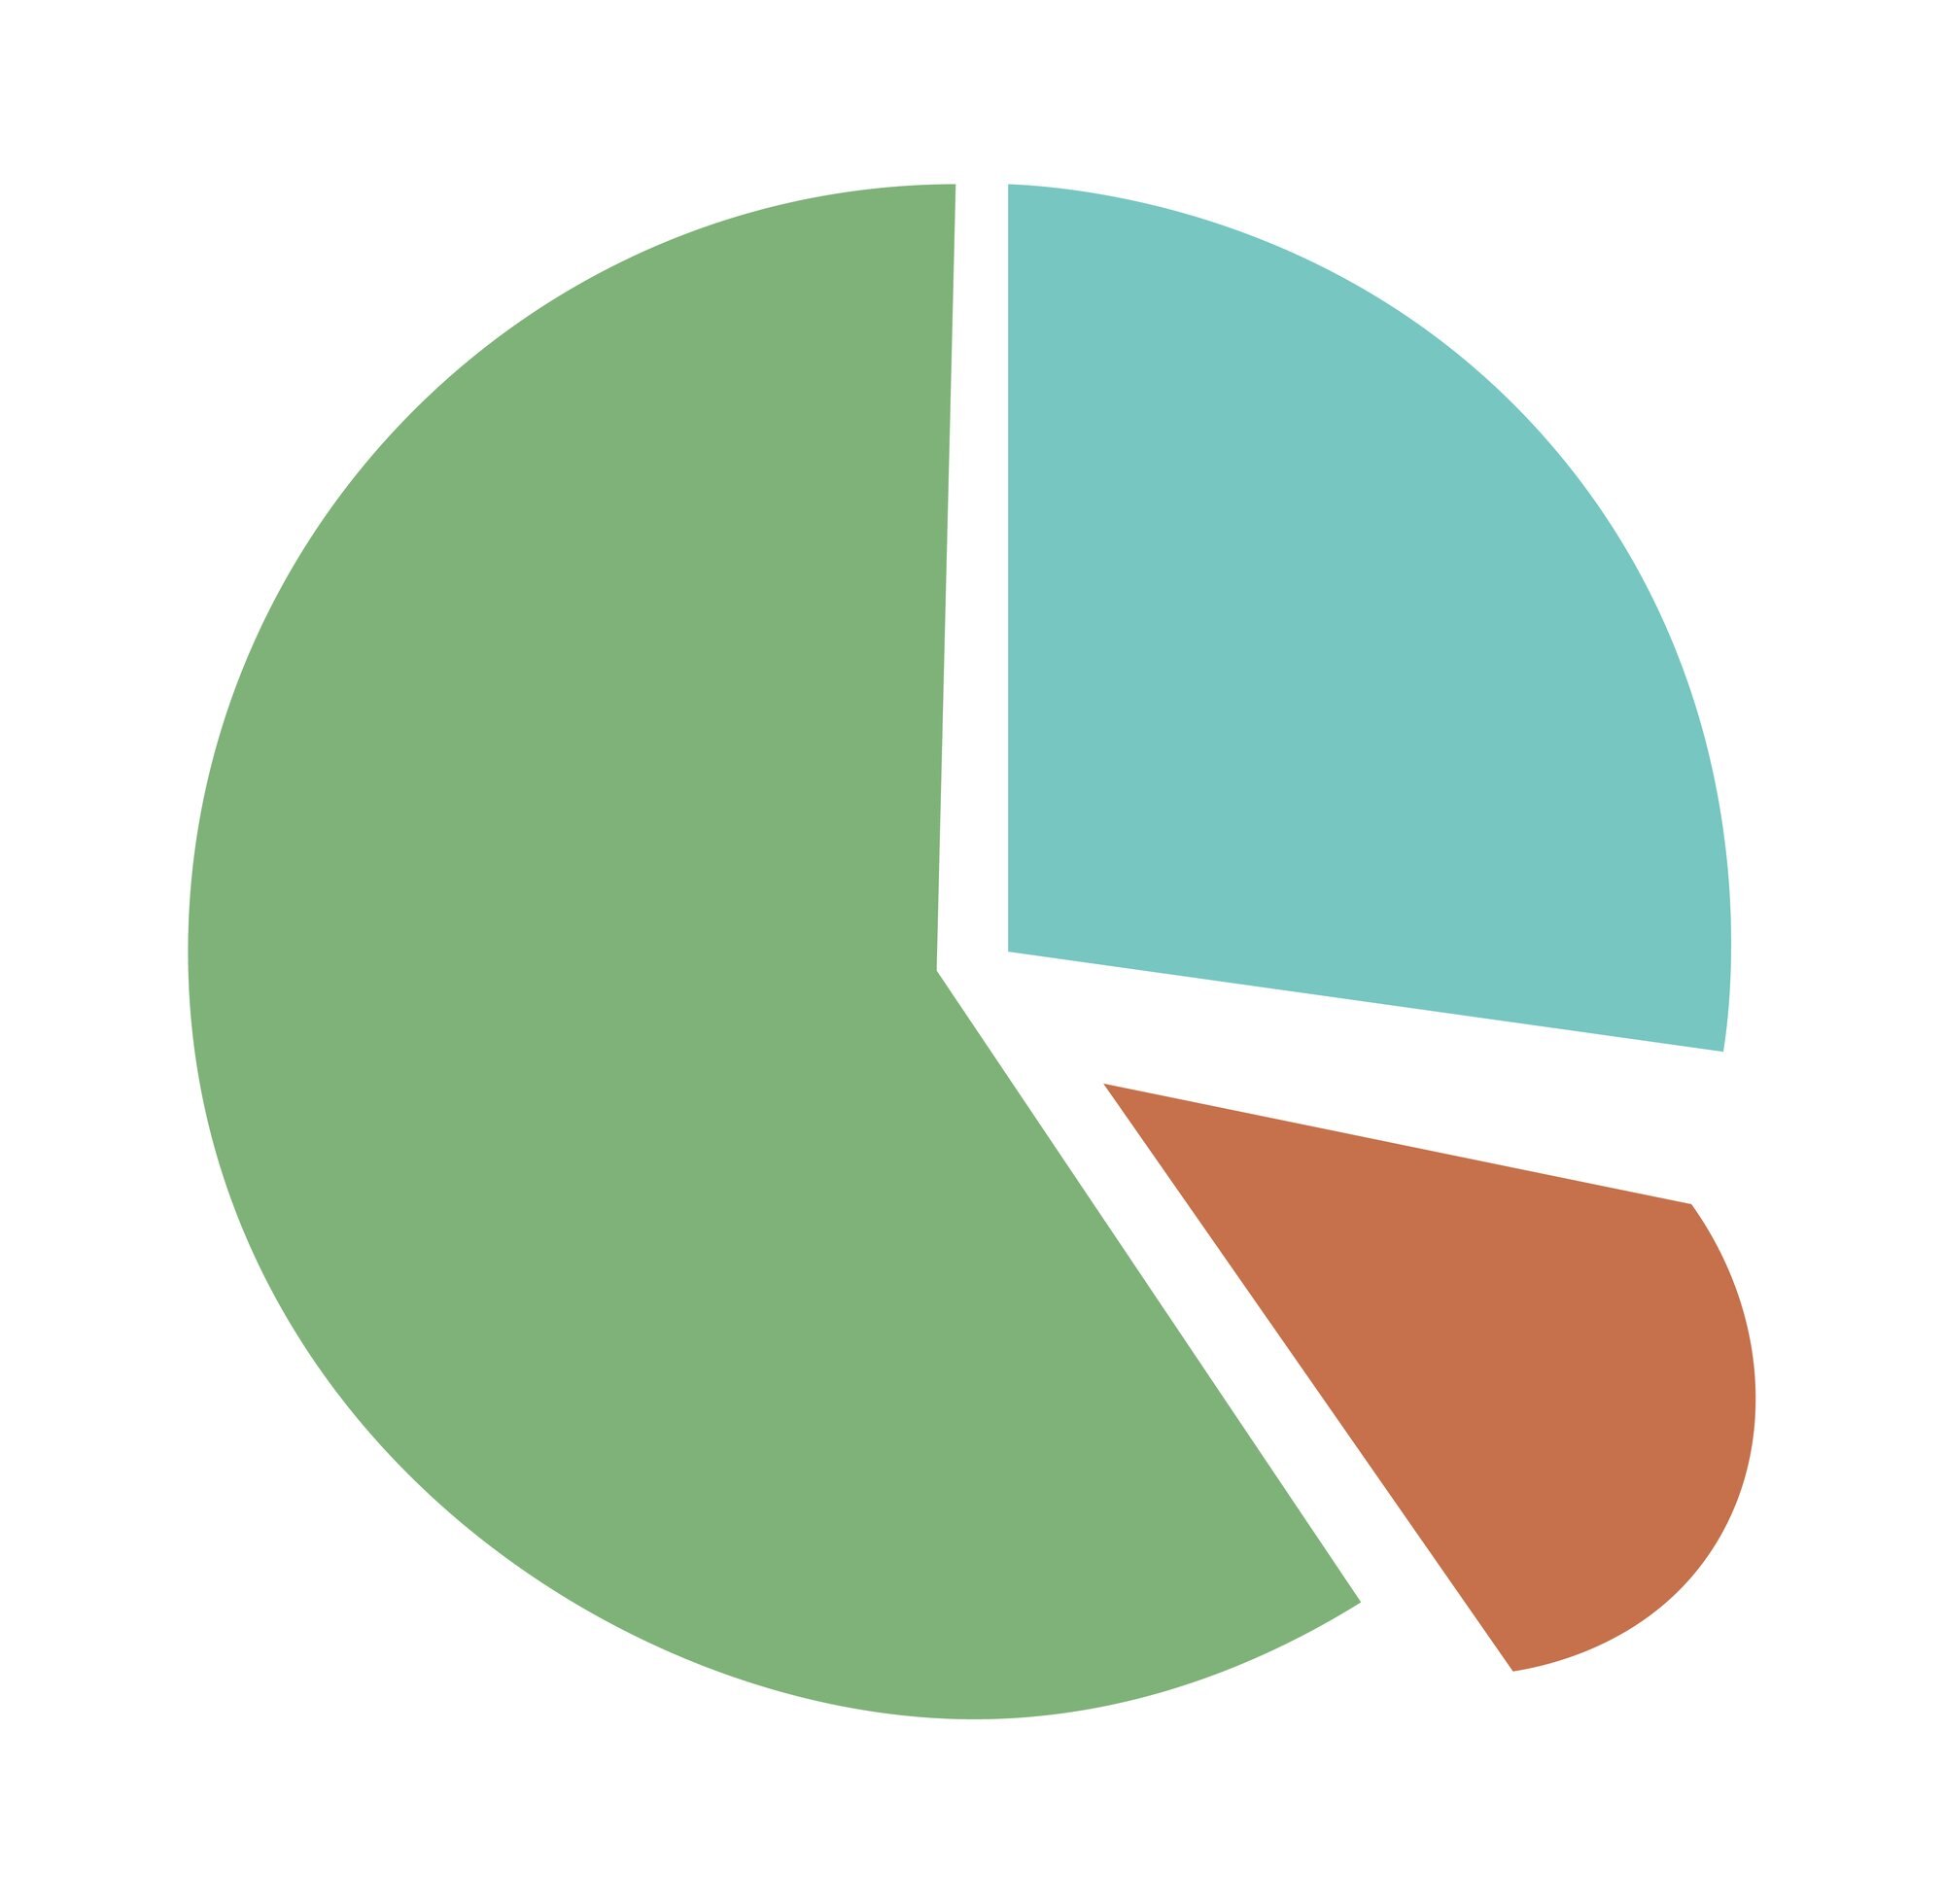
Mental Health Infographic: 8 Ideas With Text Previews
Turn a mental health infographic into a clear visual and useful next step, from a warning-sign calendar to support options. Explore eight adaptable ideas.


Turn a mental health infographic into a clear visual and useful next step, from a warning-sign calendar to support options. Explore eight adaptable ideas.
Use pie chart examples with a $4,000 budget and $100,000 in sales to connect slices to dollars, calculate shares, and compare totals. See the calculations.

What is a heat map? Learn how colors represent values, why sales dollars can be mistaken for orders, and how to read axes and legends. See the examples.

An area chart uses fill to emphasize magnitude, but stacked and separate values mean different things. See the distinctions and learn how to build one in Excel.

An SEO infographic needs more than an image. Connect your search question, visual, file and publishing page in five steps to make it useful. See the steps.

A line plot turns nine bean pod lengths into visible counts. Learn what marks and stacks mean, then build your own with fractions. See the worked example.

See how a climate change infographic links heat-trapping gases to rising heat, then separates emissions cuts from adaptation. Explore the causes and actions.

Read a neural network diagram without confusing scores with probabilities. Learn how arrows, layers, and activation labels clarify outputs. See the article.
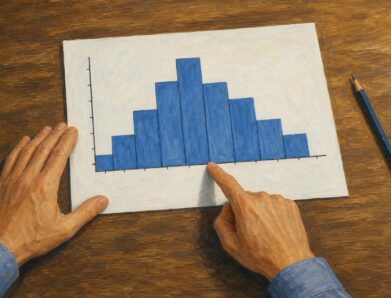
Learn how to read a histogram using book-length examples. Check axes, interpret counts, and see why unequal bin widths need area. Read the walkthrough.

A stacked bar chart shows totals and the parts behind them. Learn when to use counts or percentages, with a worked example and Excel steps. See the guide.