VISUAL COMPLEXITY
  • Book
  • Contact Us
  • VisualComplexity
    • Blog
    • Embed
    • Book
    • About Us
  • Trending Books

Account

Forgot Password?
Create Account

Create Account

A password will be sent to your email address.

Your personal data will be used to support your experience throughout this website, to manage access to your account, and for other purposes described in our privacy policy.

Already have an account? Login

Forgot Password?

Remember your password? Login
HomeArts & Photography
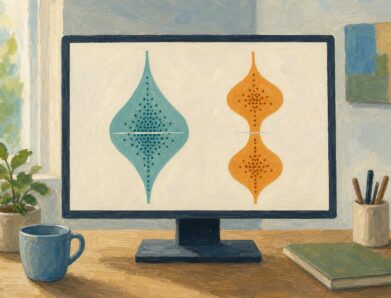
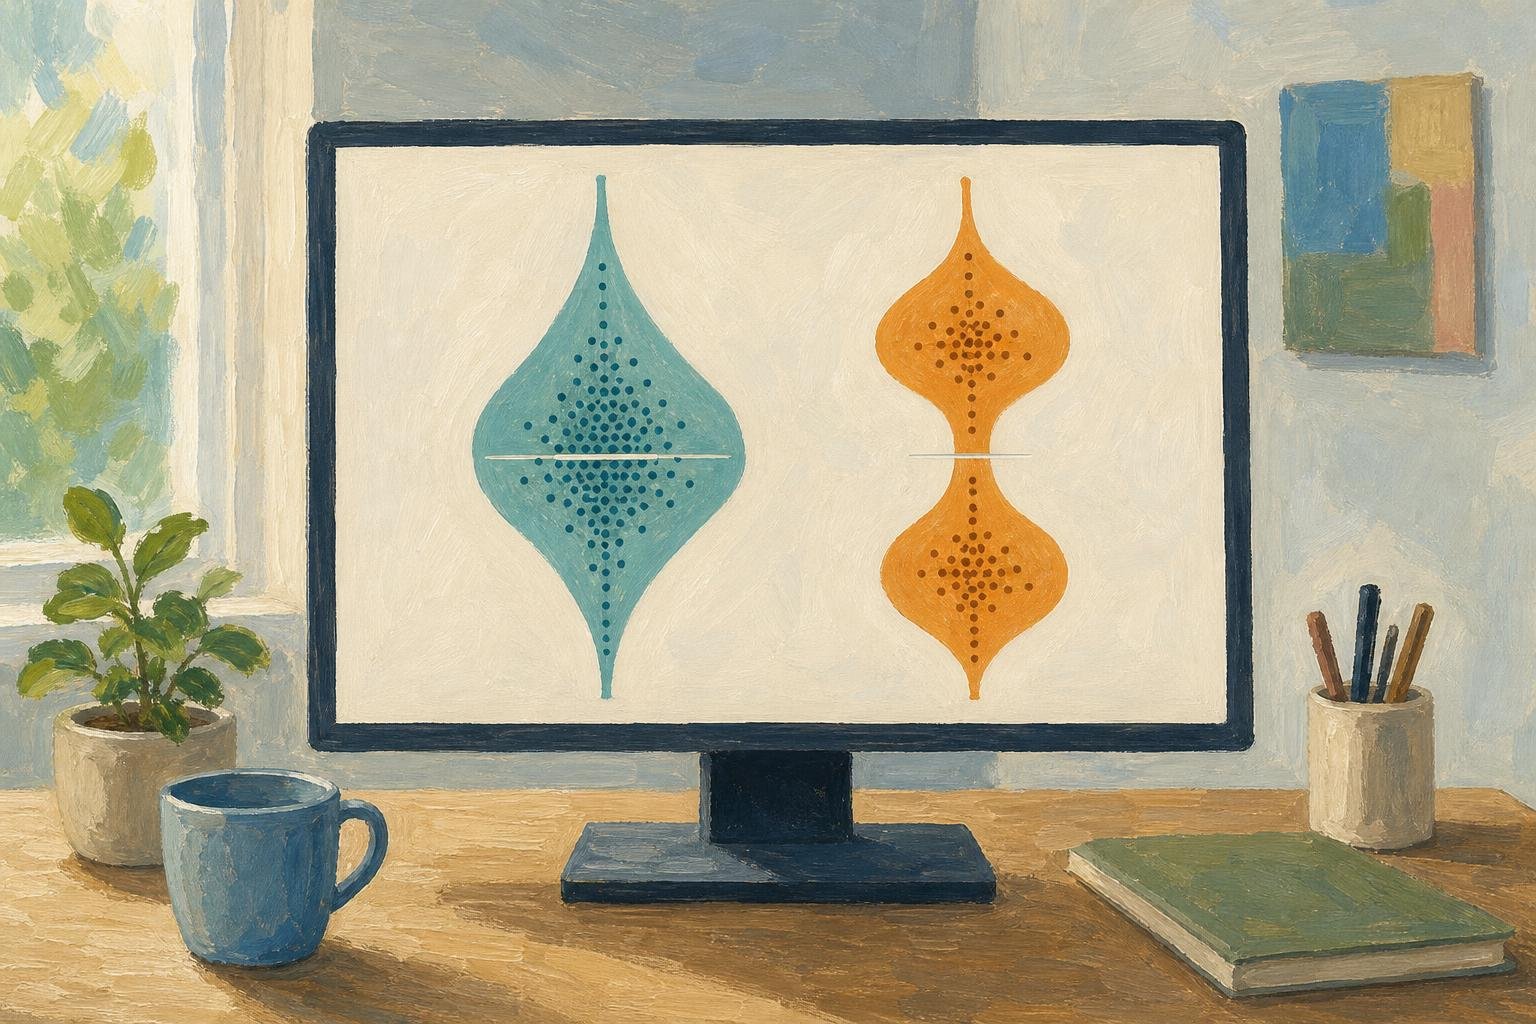
Inside a Violin Plot: Same Median, Different Shapes
Arts & Photography

Inside a Violin Plot: Same Median, Different Shapes

A violin plot can reveal different bill patterns behind the same median. Learn how shape, points, and smoothing affect comparisons. See the restaurant example.

November 11, 2026
What Is a Diagram? Explanation, Not Just Illustration
Arts & Photography

What Is a Diagram? Explanation, Not Just Illustration

What is a diagram? Learn how labeled shapes and connecting lines explain relationships, how diagrams differ from drawings, and how to read one. Read on.
November 10, 2026
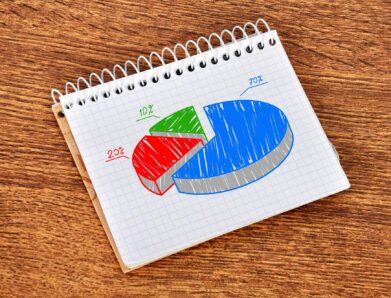
A Circle Graph’s Largest Slice Isn’t Always a Majority
Arts & Photography

A Circle Graph’s Largest Slice Isn’t Always a Majority

Read a circle graph without mistaking the largest slice for a majority. Follow a 40-student survey from counts to percentages and angles. See how it works.
November 8, 2026
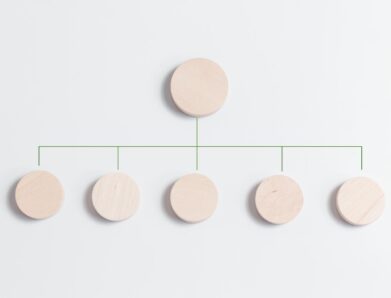
Tree Diagram Rules: Clear Branches, No Loops Allowed
Arts & Photography

Tree Diagram Rules: Clear Branches, No Loops Allowed

Learn how a tree diagram connects roots, children and leaves, then follow paths and calculate probabilities without confusing it with a flowchart. Read more.
November 6, 2026
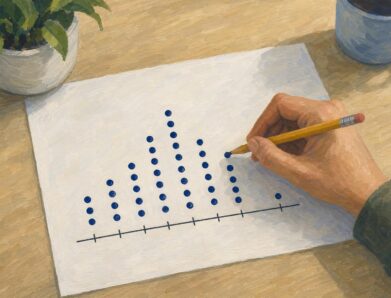
Dot Plot Explained: What Each Stacked Dot Tells You
Arts & Photography

Dot Plot Explained: What Each Stacked Dot Tells You

A dot plot puts each observation above a number line. Learn how stacked dots show frequency and why equal spacing matters. See the study-time example.
November 3, 2026
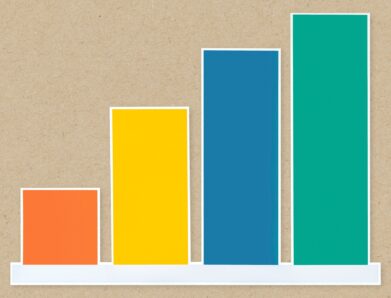
Bar Graph Scales: How Small Changes Look Much Bigger
Arts & Photography

Bar Graph Scales: How Small Changes Look Much Bigger

A bar graph can make 35% to 39.6% look like a huge leap. Learn how scales and layouts shape comparisons, then build one from a small table. See the guide.
November 2, 2026
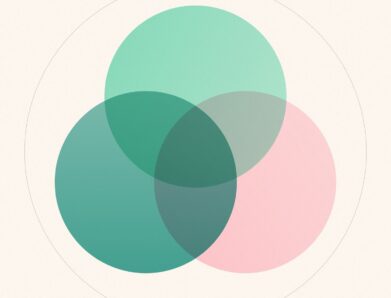
Venn Diagram: Why Club Rosters Can Count Students Twice
Arts & Photography

Venn Diagram: Why Club Rosters Can Count Students Twice

A Venn diagram explains how 18 art-club and 14 music-club members fit in a class of 30. Learn to read overlaps and avoid double counting. See how it works.
November 1, 2026

Search

Categories

  • Arts & Photography (7)
  • Blog (46)

Recent Post

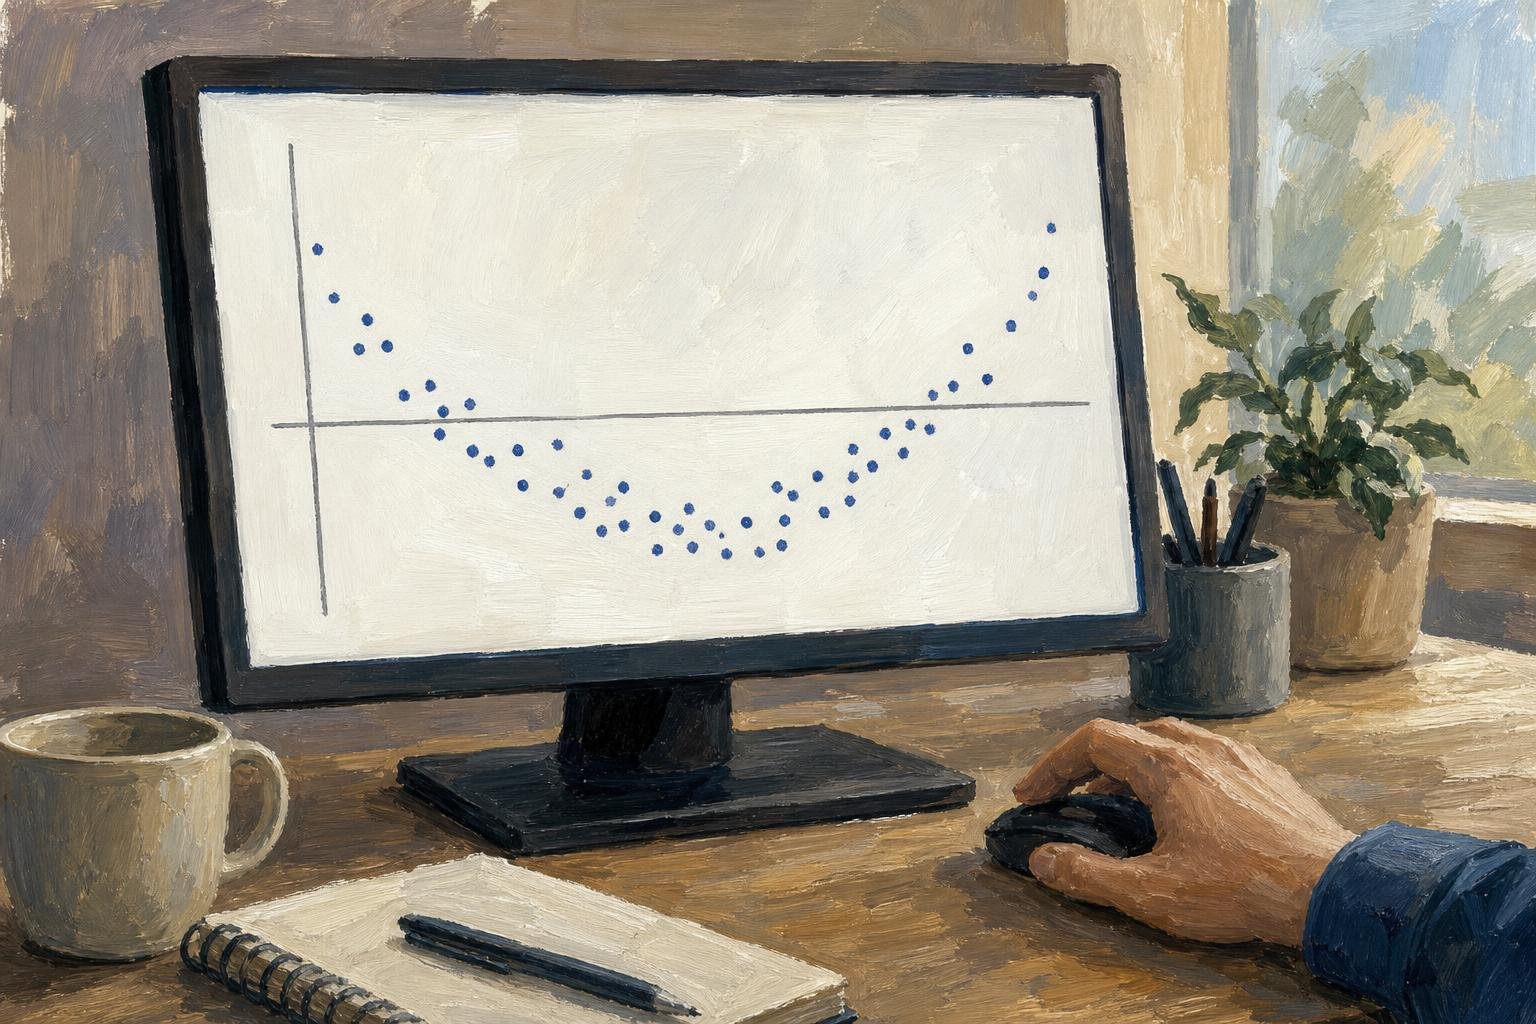
Your Residual Plot: What a $5 Error Says About Fit
November 12, 2026
Inside a Violin Plot: Same Median, Different Shapes
November 11, 2026
Circular Flow Diagram: A $4 Loaf Links Two Markets
November 11, 2026

Explore

  • About as
  • Sitemap
  • Terms and Conditions
  • Privacy Policy

©2025 web-books.com. All rights reserved