


A stem and leaf plot turns an unsorted list of numbers into ordered rows while keeping every observation visible. Each number splits into a stem and a final digit called a leaf, so you can see both the individual values and where they gather. For a jumble of student reading times, that means finding the middle without losing track of anyone’s result.
Student Reading Times (Minutes)
Stem | Leaves
  1  | 5 8
  2  | 1 2 2 4 7
  3  | 0 2 5 7
  4  | 1 6
  5  | 3

Key: 3 | 5 = 35 minutes
In This Article
- Build a Plot From Unsorted Data
- When Is This Display Useful?
- Read Values and Calculate Statistics
- Recognize Clusters, Gaps, and Skewness
- Choose Place Values for Decimals
- Compare Two Groups With Shared Stems
- Key Takeaways
- Frequently Asked Questions
- What a Stem and Leaf Plot Shows
Build a Plot From Unsorted Data
Suppose 14 students report these reading times, in minutes:
35, 22, 15, 41, 27, 53, 22, 18, 32, 24, 46, 21, 37, 30
Use the tens digit as the stem and the ones digit as the leaf. Split 35 into stem 3 and leaf 5. Both occurrences of 22 must stay: they belong to separate students.
Place each leaf beside its stem, then sort the stems and each row’s leaves from smallest to largest. Add a title, units, and a key.
Count the leaves before using the result. This stem plot example has 14, matching the original list; a missing repeat would make that count fall short.
When Is This Display Useful?
Stem and leaf plots suit small numerical datasets when exact values matter. A classroom’s reading times fit: you can compare students’ times and still recover each observation. A histogram groups those observations into intervals, hiding the individual values.
Keeping every value visible also creates the display’s limit. Hundreds of leaves crowd the rows; many distinct stems stretch the plot until its shape becomes hard to see. A stem plot works when you can read its individual digits. When those digits become clutter, a histogram gives the clearer view.
Read Values and Calculate Statistics
How far apart are the shortest and longest times? The minimum is 15 minutes and the maximum is 53, giving a range of 53 − 15 = 38 minutes. Read each leaf separately with its stem: stem 2 holds five observations, not one large number.
What is the middle time? With 14 observations, average the values in positions 7 and 8: the median is (27 + 30) ÷ 2 = 28.5 minutes. Which time occurs most often? The repeated 22 is the mode.
Need the mean instead? The reconstructed times total 423 minutes, so the mean is 423 ÷ 14 ≈ 30.21 minutes. Divide by the observation count, not by the number of stems. Adding leaf digits alone discards their place value.
How many students read for more than 30 minutes? Exclude 30 itself, then count the nonzero leaves on stem 3 and all leaves on stems 4 and 5: 32, 35, 37, 41, 46, and 53. That gives six students.
Recognize Clusters, Gaps, and Skewness
The twenties form the largest cluster in the reading-time display. Row lengths reveal that concentration; the spread on either side helps describe the shape. Roughly balanced sides suggest symmetry, while a longer tail toward larger values indicates right skew. A tail toward smaller values indicates left skew.
The largest observation is not automatically an outlier. There is no obvious isolated extreme in these reading times. If an extra student reported 153 minutes, however, that time would sit far beyond the main group: a potential outlier worth investigating, not automatically an error.
An empty interval tells a different story. For the values 12, 14, 16, 31, and 33, keep stem 2 between stems 1 and 3, with no leaves beside it. Removing that row would disguise the gap: nobody falls in the twenties.
Choose Place Values for Decimals
A zero can be an observation, not an empty space. With whole numbers as stems and tenths as leaves, 5 | 0 means 5.0. Leaving that leaf out loses a measurement; leaving an entire leaf area blank means there was no observation there.
For measurements of 4.2, 4.5, and 5.1 centimeters, that same arrangement uses the key 4 | 2 = 4.2 centimeters. Hundredths need a different leaf unit, such as 4.2 | 7 = 4.27 centimeters. Keep the chosen unit consistent throughout.
Whether a worksheet calls this a leaf plot or a stem and leaves plot, its label cannot tell you the precision. The key can.
| Plot option | Best for | Example row and reading key | Pros | Cons |
|---|---|---|---|---|
| Two-digit whole numbers | Integer scores such as 42, 45 and 49 | 4 | 2 5 9; key: 4 | 2 = 42 | Tens as stems; ones as leaves; retains each exact score | Can require multiple stem rows |
| Three-digit whole numbers | Counts such as 123, 126 and 128 | 12 | 3 6 8; key: 12 | 3 = 123 | Multi-digit stems retain exact counts without rounding | Can require many stem rows |
| Decimals to tenths | Lengths such as 4.2, 4.5 and 4.9 cm | 4 | 2 5 9; key: 4 | 2 = 4.2 cm | Whole-number stems preserve measurements to 0.1 cm | A value such as 4.27 cm requires rounding or a different leaf unit |
| Decimals to hundredths | Lengths such as 4.27, 4.28 and 4.29 cm | 4.2 | 7 8 9; key: 4.2 | 7 = 4.27 cm | Tenths as stems preserve measurements to 0.01 cm | Can require many stem rows |
Compare Two Groups With Shared Stems
Back-to-back stem plots place two groups on opposite sides of shared stems. Suppose Group A’s reading times are 15, 22, 22, and 35 minutes; Group B’s are 18, 24, 32, and 37 minutes.
Group A | Stem | Group B
    5   |  1   | 8
  2 2   |  2   | 4
    5   |  3   | 2 7

Key: Left 5 | 1 = 15 minutes;
     right 1 | 8 = 18 minutes
Leaves increase outward from the stem on both sides, reversing their reading direction on the left. Both groups use the same units and place values.
Group B has a higher median: (24 + 32) ÷ 2 = 28 minutes, compared with 22 minutes for Group A. With unequal group sizes, longer rows alone would not establish higher values; compare centers and spread.
Key Takeaways
- Each leaf counts as an observation, even when digits repeat.
- The key establishes place value and units.
- Ordered rows and a matching leaf count help catch construction errors.
- Statistics use reconstructed values, not isolated leaf digits.
- Shared stems put two groups on a common scale.
Frequently Asked Questions
How do you solve stem-and-leaf plot math problems?
Read the key, identify the observations the question needs, and calculate from their full values. For threshold questions, “greater than or equal to” includes the boundary value; “greater than” excludes it.
Can the same leaf appear more than once on a stem?
Yes, repeated leaves represent repeated observations. With tens as stems, 6 | 3 3 records two values of 63; deleting either changes the dataset.
How do you show a stem with no observations?
Write the stem with its leaf area blank. A zero would record a value, not an absence.
When should you split a stem into two rows?
Split stems when crowded rows make individual leaves hard to read. Conventionally, one row holds leaves 0–4 and the next holds 5–9; use that division for every stem.
Can a stem-and-leaf plot show negative numbers?
Yes, provided the key clearly defines the sign convention. If −2 | 3 means −23, remember that −23 is less than −21, so increasing leaf digits do not automatically put negative values in increasing numerical order.
What a Stem and Leaf Plot Shows
A stem and leaf plot preserves individual observations while arranging them into a readable distribution. In the reading-time example, the ordered leaves reveal repeated values, the middle observations, and the distance between the shortest and longest times. Those same values support calculations of the mean, median, mode, and range without losing the original measurements.
The key makes that detail interpretable by defining each leaf’s place value and units. Different leaf units accommodate whole numbers or decimals, while shared stems let two groups appear on a common scale. Empty rows reveal gaps, and repeated leaves preserve repeated observations. The result combines a view of the data’s shape with access to its exact values, as long as the display remains small enough for its individual leaves to be read.
Recommended for you

Infographic Ideas That Answer Real Everyday Questions
Find infographic ideas for report findings, customer questions, budgets, and more. Match each question to a clear visual structure—explore the examples.

Comparing Histogram vs Bar Graph: What Values Reveal
The histogram vs bar graph choice starts with categories versus numerical observations. Learn how bins and axes shape each chart, and see which fits your data.

The Visual Language of Books: How Covers Communicate Complexity
At thumbnail size—often 100–160 pixels wide on retail grids—a cover must communicate genre, tone, and complexity before a reader can zoom in. The difference between a muddled thumbnail and a crisp focal point can determine whether a title gets a click, a pickup, or a pass. If you want a practical method for turning ideas […]

Waterfall Chart: The Losses Behind a Positive Result
A waterfall chart reveals gains and losses behind net growth. Follow revenue from $500,000 to $580,000 and learn to read the floating bars. See the example.
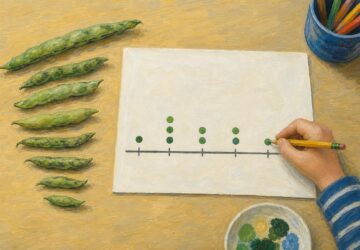
Math Line Plot: Each Mark a Measurement, Each Stack a Count
A line plot turns nine bean pod lengths into visible counts. Learn what marks and stacks mean, then build your own with fractions. See the worked example.
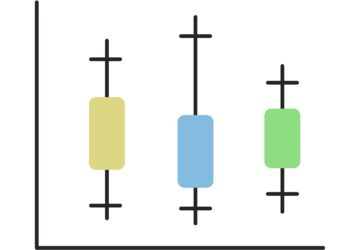
Box Plot Reading: A Shorter Box Doesn’t Mean Faster
A box plot shows center and spread, not speed alone. Use task-time examples to compare medians and variability on the same scale. See the worked example.

How to Make an Infographic: A Worked Canva Example
Learn how to make an infographic in Canva, from a clear brief to a readable design, using a fictional maintenance log. Follow the step-by-step walkthrough.
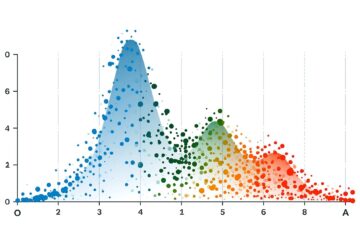
Bimodal Histogram: Two Peaks That One Average Can Hide
A bimodal histogram can reveal two operating conditions. Use the 15 and 25 millisecond test example to read the peaks and plan your next analysis. See how.