
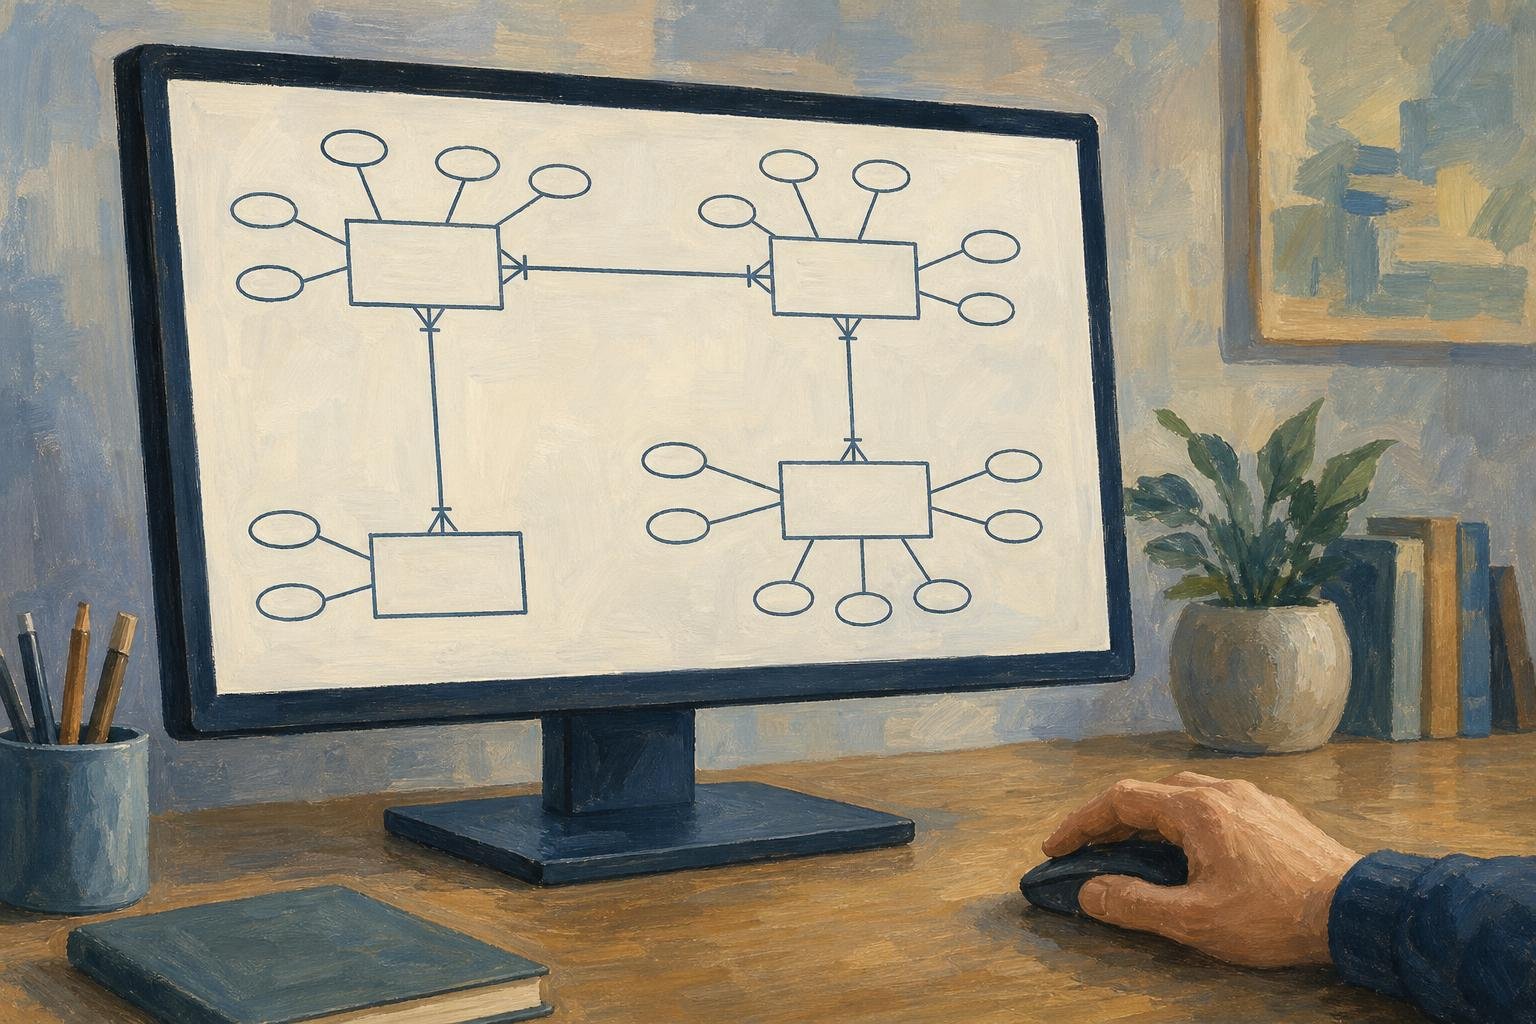

Without an ER diagram, a sales database can end up storing only a product’s current price, leaving old orders with no record of what customers actually paid. An entity relationship diagram maps the kinds of data a system stores and the rules connecting them, so you can catch that missing connection before building tables. The customer-order example below follows each design choice from a business rule to a structure you can test.
In This Article
- What the Model Describes
- Choose the Right Level of Detail
- Read the Symbols and Relationship Rules
- Describe Entities With Attributes and Keys
- Handle Dependent and Self-Related Entities
- Work Through a Customer Order Example
- Draw and Test Your Model
- Key Takeaways
- Frequently Asked Questions
- Turn Business Rules Into Structure
What the Model Describes
The missing price belongs to a sale, not simply to a product. That distinction is the work of modeling: deciding which thing owns each fact. An entity is something the system must distinguish and store information about; a relationship expresses an association between instances of those things.
In a rental business, Apartment and Lease could be entity types, while apartment 4B is one instance. Connecting Lease to Apartment lets you describe which apartment a lease covers without copying the apartment’s details into every lease. The model describes permitted associations, including ones that do not exist yet.
Peter Chen introduced the entity–relationship model in 1976. Separating entities from their relationships gives a team a concrete question to settle before implementation: does this fact describe the apartment, the lease, or their connection?
Choose the Right Level of Detail
A conceptual model settles scope. Customer places Order might be enough to expose a crucial question: can someone buy without registering? An entity diagram at this level gives business users a decision they can make without knowing SQL.
Suppose a team spends that review debating the length of Customer.Email and leaves guest checkout unresolved. The resulting design might require CustomerID on every order, while the checkout accepts buyers without customer accounts. The first guest purchase then has nowhere valid to go. The column-length decision solved the wrong problem.
A logical model addresses the structure behind that purchase, adding attributes and identifiers without committing to a database product. A physical model adds implementation details: a logical OrderDate attribute might become a PostgreSQL date column in a physical database ER diagram. Some tools blur these levels; name the review’s purpose before opening the drawing.
Read the Symbols and Relationship Rules
Suppose a developer reads an unclear Customer–Order line as “every customer needs an order” and makes account creation require a purchase. If customers may register before buying, that implementation has reversed the rule. A relationship diagram needs to communicate both ends of the connection unambiguously.
Chen notation separates entities into rectangles, relationships into diamonds, and attributes into ovals. Crow’s Foot usually keeps attributes inside entity boxes. Choose a notation whose constraints your audience can read:
| Notation style | Distinctive symbols and constraints | Best for | Main strength | Main limitation |
|---|---|---|---|---|
| Chen notation | 1, N, or M relationship labels; double lines for total participation; double ovals for multivalued attributes | Conceptual models that distinguish entities, relationships, and attributes | Makes relationship attributes and multivalued attributes explicit | Separate attribute symbols make attribute-heavy models bulky |
| Crow’s Foot notation | Line-end combinations express zero-or-one, exactly one, zero-or-many, and one-or-many | Logical and physical relational database models | Shows minimum and maximum relationship cardinality compactly | Key labels and identifying-relationship line styles depend on the notation variant |
| IDEF1X notation | Solid identifying links; dashed non-identifying links; rounded corners for identifier-dependent entities | Relational models requiring explicit primary-key dependencies | Distinguishes relationships that contribute to a child’s primary key | Requires familiarity with identifier dependence and formal modeling rules |
| UML class notation | Association-end multiplicities such as 0..1, 1, 0.., and 1.. | Data models shared with software class designs | Uses explicit numeric multiplicities and supports named association roles | Database primary keys and foreign keys need added conventions or stereotypes |
In Crow’s Foot, a fork means many, a bar means one, and a circle allows zero. At the Order end, a circle plus fork says one customer may have zero or many orders. Read the Customer end separately: exactly one means every order requires one customer.
The minimum expresses optionality; the maximum expresses cardinality, though some conventions call the whole range cardinality. Write both directions in words before marking the line. If readers know different notation, include a legend. UML class diagrams can also describe software behavior, so shared multiplicity symbols alone do not make them database models.
Describe Entities With Attributes and Keys
Making Email unique can reject a second customer who shares an address with the first. Allowing duplicates can break a process that assumes an email identifies exactly one account. Neither choice is automatically correct: the business must decide, and the database must enforce the chosen rule.
That identity decision differs from describing a customer. CustomerID and Email are attributes; CustomerID can serve as the identifier even when Email is not unique. Attribute categories answer other questions about the values you store, and one attribute can fit several categories:
| Attribute type | Meaning in an ER diagram | Concrete example | Chen notation | Modeling consideration |
|---|---|---|---|---|
| Simple (atomic) | Not divided into smaller parts for this model | Product.UnitPrice = 19.99 | Oval connected to the entity | Atomicity depends on the model’s requirements |
| Composite | Contains meaningful component attributes | Address → Street, City, PostalCode | Parent oval connected to component ovals | Expose components when they need separate queries or validation |
| Single-valued | Has at most one value per entity instance | Employee.BirthDate = 1990-04-12 | Single oval outline | Single-valued does not mean mandatory or unique |
| Multivalued | Can hold multiple values for one entity instance | Employee.PhoneNumber = {+1-212-555-0101, +1-212-555-0102} | Double oval | Typically maps to a separate table linked by a foreign key |
| Stored | Recorded directly rather than calculated from other attributes | Employee.BirthDate stored as 1990-04-12 | Ordinary solid-outline oval | Can supply the source value for a derived attribute |
| Derived | Calculated from other data | Employee.Age calculated from BirthDate and the current date | Dashed oval | Record the calculation rule; age changes even without a record update |
| Key | Uniquely identifies an entity within its entity set | Customer.CustomerID = C1042 | Underlined attribute name | A composite key uses multiple attributes together |
Value restrictions need attention too. Quantity might permit only positive whole numbers; that permitted set is its domain. Record restrictions in notes when the notation cannot express them. Store multiple phone numbers in related rows, not a comma-separated cell.
For identity, a candidate key is a minimal set of attributes that uniquely identifies a record. The primary key is the candidate you choose; a foreign key references a primary or otherwise unique key in the same or another table. Choosing CustomerID does not settle whether Email also needs a uniqueness constraint.
Handle Dependent and Self-Related Entities
OrderLine exposes a different identity problem: line 1 can occur in many orders. It needs OrderID together with LineNumber. This is a weak entity’s identifying dependence on its owner, which Chen notation marks with a double rectangle and a double diamond for the identifying relationship. Merely having a required foreign key does not establish that dependence.
Relationships can also involve more than two roles. Suppose a supplier provides a part to one project, while another supplier provides that same part to a different project. Separate Supplier–Part and Part–Project links would preserve who supplies the part and which projects use it, but lose who supplied it to which project. The ternary relationship Supplier supplies Part to Project preserves the complete fact.
That three-way relationship differs from the binary Customer places Order connection. A unary, or recursive, relationship uses one entity type twice: Employee supervises Employee. Name the supervisor and subordinate roles so a reader knows which employee occupies each end.
Work Through a Customer Order Example
For a small sales system, use Customer, Order, Product, and OrderLine. Customer has CustomerID as its primary key; Product has ProductID. Order has an OrderID primary key and a CustomerID foreign key. For this example, every order belongs to exactly one registered customer; guest checkout is not supported.
OrderLine uses the owner-dependent key already described and references exactly one product through ProductID. A product can appear on many lines across different orders. This resolves the many-to-many association between orders and products and gives Quantity and UnitPriceAtPurchase a home. Keeping the charged price there prevents later product-price changes from rewriting sales history.
For order 1042, line 1 could hold two units of P17 at $12 each; line 2 could hold one unit of P23 at $8. The amounts are $24 and $8, giving a $32 merchandise subtotal before tax or shipping. The same product can appear on separate lines because ProductID does not identify the line.
An issued order requires at least one line in this example. Empty drafts create a status-dependent exception: allow no lines while drafting, then require a line before issue. Document that condition beside the diagram; a single relationship marker cannot express it fully.
Draw and Test Your Model
Write permitted situations first, then turn their nouns into candidate entities and their associations into relationships. Assign identifiers before secondary attributes. When drawing ERD diagrams, keep the notation consistent and label relationships with verbs. A drawing tool suits discussion; a schema-aware tool suits database-specific types or SQL generation.
Test the drawing with someone who handles real transactions. Can a line reference a nonexistent product? Foreign keys can prevent that. Can two customers share an email? Apply the decision made earlier. Then address deletion explicitly: if a customer account is removed, should historical orders remain, block the deletion, or disappear with it?
Key Takeaways
- Model the owner of each fact before choosing columns.
- Keep conceptual scope decisions separate from physical implementation details.
- Read each relationship in both directions, including its minimum participation.
- Treat keys and uniqueness constraints as business decisions.
- Test exceptions such as empty drafts before implementing the model.
Frequently Asked Questions
What is in an ER diagram?
Its components typically include entity boxes, relationship lines, attributes, identifiers, and markers for minimum and maximum participation. Logical and physical diagrams may also label foreign keys; physical diagrams may specify column types.
Can ChatGPT create an ER diagram?
Yes, ChatGPT can propose an ER diagram from a description and generate diagram text such as Mermaid. Treat generated relationships as assumptions to test: an omitted guest-checkout rule can produce the wrong customer requirement.
How do I draw an ERD diagram?
Identify what the system stores, assign keys, and connect the entities with explicit participation rules. Test those rules against exceptions before translating the drawing into tables.
What is an ERD?
ERD stands for entity–relationship diagram: a visual model of the kinds of data a system stores and how they relate.
Is an ER diagram the same as a database schema?
No, an ER diagram can represent business concepts without specifying an implemented database schema. Even a physical model may omit schema details such as indexes and access permissions.
Turn Business Rules Into Structure
Before implementation, walk one transaction and its exceptions through the model with a business user. For each step, identify the entity or relationship that holds the fact, check the permitted associations, and ask what must remain true after later changes. If the system must handle discounts or returns, test those cases too. Record unresolved rules beside the drawing before approving it.
Recommended for you

Line Graph Scales: Why the Same Data Can Look Different
A line graph can exaggerate a modest change. Learn to check axes, read a five-month sales example and build clearer charts from your data. Explore the article.

What Is a Diagram? Explanation, Not Just Illustration
What is a diagram? Learn how labeled shapes and connecting lines explain relationships, how diagrams differ from drawings, and how to read one. Read on.

How to Make an Infographic: A Worked Canva Example
Learn how to make an infographic in Canva, from a clear brief to a readable design, using a fictional maintenance log. Follow the step-by-step walkthrough.

Reading a Linear Graph: Why the Slope Stays the Same
Understand a linear graph through constant slope, intercepts, and y = mx + b. Turn equations into points you can plot with confidence. See how it works.
Pie Chart Examples: The Dollar Totals Behind Each Slice
Use pie chart examples with a $4,000 budget and $100,000 in sales to connect slices to dollars, calculate shares, and compare totals. See the calculations.

Symmetric Histogram: Balance Beyond the Tallest Bar
A symmetric histogram mirrors bars around a center, not always its tallest peak. Compare tails and see how bin boundaries affect balance. Read the example.

Math Line Plot: Each Mark a Measurement, Each Stack a Count
A line plot turns nine bean pod lengths into visible counts. Learn what marks and stacks mean, then build your own with fractions. See the worked example.
Dot Plot Explained: What Each Stacked Dot Tells You
A dot plot puts each observation above a number line. Learn how stacked dots show frequency and why equal spacing matters. See the study-time example.