
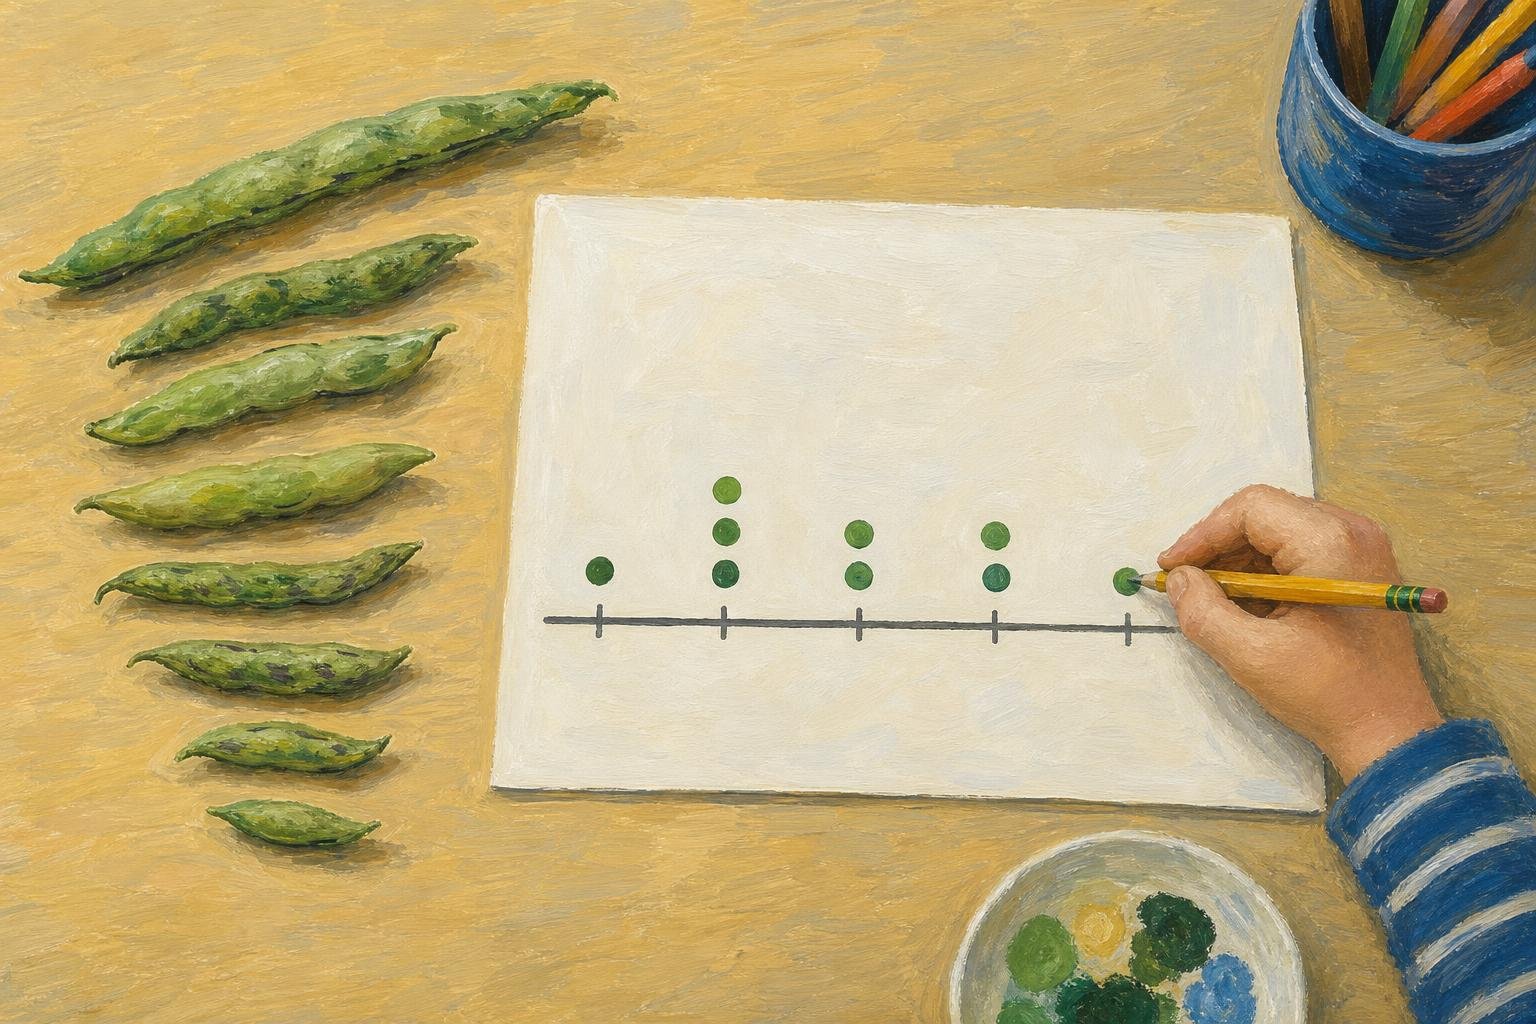

Nine bean pods lie on the table: which lengths keep turning up? In elementary math, a line plot answers by placing one mark above a number line for each measured pod, stacking marks when lengths repeat. Also called a dot plot, it keeps each observation visible, whether you use dots or Xs. This article covers that stacked display; in other visualization contexts, “line plot” can also mean a line chart with connected points.
The useful distinction is between where a mark sits and how many marks share that position. That distinction lets you read a measurement and its frequency together.
In This Article
- What Each Mark Means
- Read a Small Example
- Build One From Recorded Values
- Put Fractions on a Consistent Scale
- Find the Mode, Median, and Range
- Choose the Display and Avoid Misreadings
- Key Takeaways
- Frequently Asked Questions
- Turn Measurements Into Countable Evidence
What Each Mark Means
In a math line plot, three marks above 6 centimeters represent three objects that each measured 6 centimeters. Add another object of that length, and the stack grows upward. Measure an object at 8 centimeters instead, and its mark goes farther right.
That rightward move changes the recorded length; the upward move changes the count at one length. A tall stack can therefore represent shorter objects than a single mark farther along the scale. You can use line plots for plant heights or books read per student because those observations have numerical values. Labels such as “mystery” and “biography” call for a categorical display, such as a bar graph.
Read a Small Example
Suppose the nine bean pods have these lengths, measured in centimeters:
4, 5, 5, 6, 6, 6, 8, 8, 9
Lengths of Nine Bean Pods
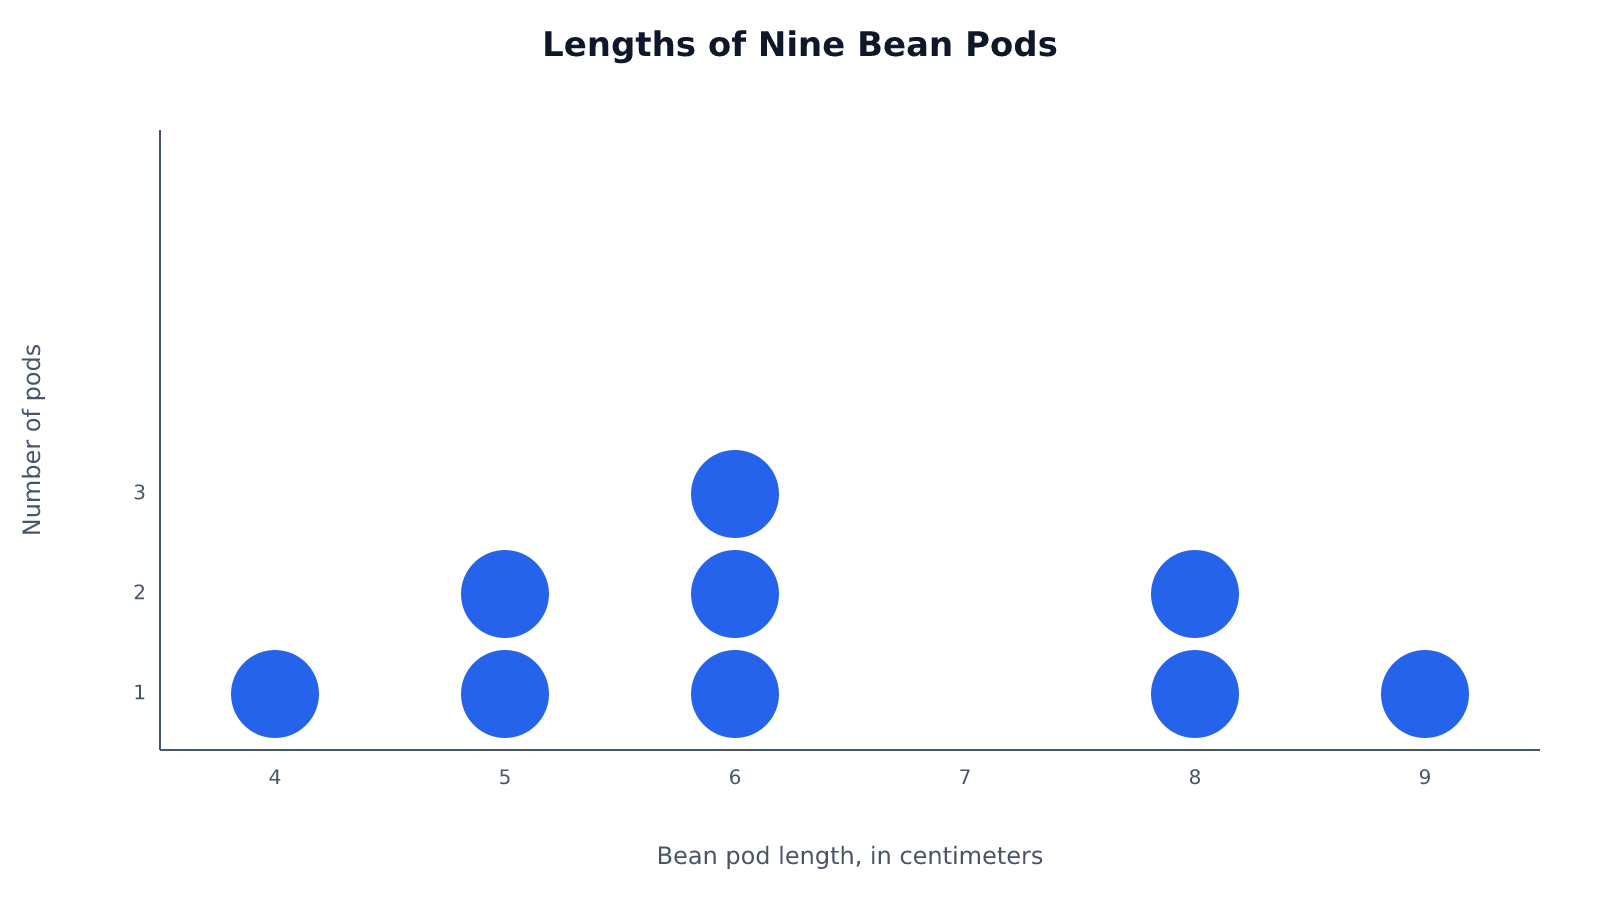
Bean pod length, in centimeters. Each mark represents one pod.
The two marks above 8 account for two pods. The three marks above 6 show that one-third of the nine pods measured 6 centimeters. That tallest stack also identifies 6 centimeters as the most common length.
Between that stack and the pair at 8 sits an empty position. It is part of the evidence, not missing data: among these nine pods, none measured 7 centimeters.
Build One From Recorded Values
To create a number line plot from these measurements, use the smallest and largest observations as the ends of your scale. Draw equally spaced ticks from 4 through 9 and label the unit as centimeters. Leave room above the line for stacks.
Now transfer the recorded values one at a time. Suppose you plot 4, then 5, and move straight to 6 because you have already marked 5. You have skipped a pod. The second 5 needs its own X above the first; a repeated value is still another observation.
Tracking each entry as you plot prevents that mistake. Cross off each measurement only after placing its mark, then compare your total with the nine original entries. Give the finished display a title such as “Lengths of Nine Bean Pods.” The title identifies the group; the axis label tells readers what was measured.
Put Fractions on a Consistent Scale
Consider eight ribbon lengths, in inches:
2, 2¼, 2¼, 2½, 2¾, 2¾, 2¾, 3
Quarter-inch ticks accommodate every measurement here. Label the positions 2, 2¼, 2½, 2¾, and 3, then stack the marks. The whole numbers belong on that same scale. Writing 2½ as 2²⁄₄ can help show why the steps are equal.
Lengths of Eight Ribbons
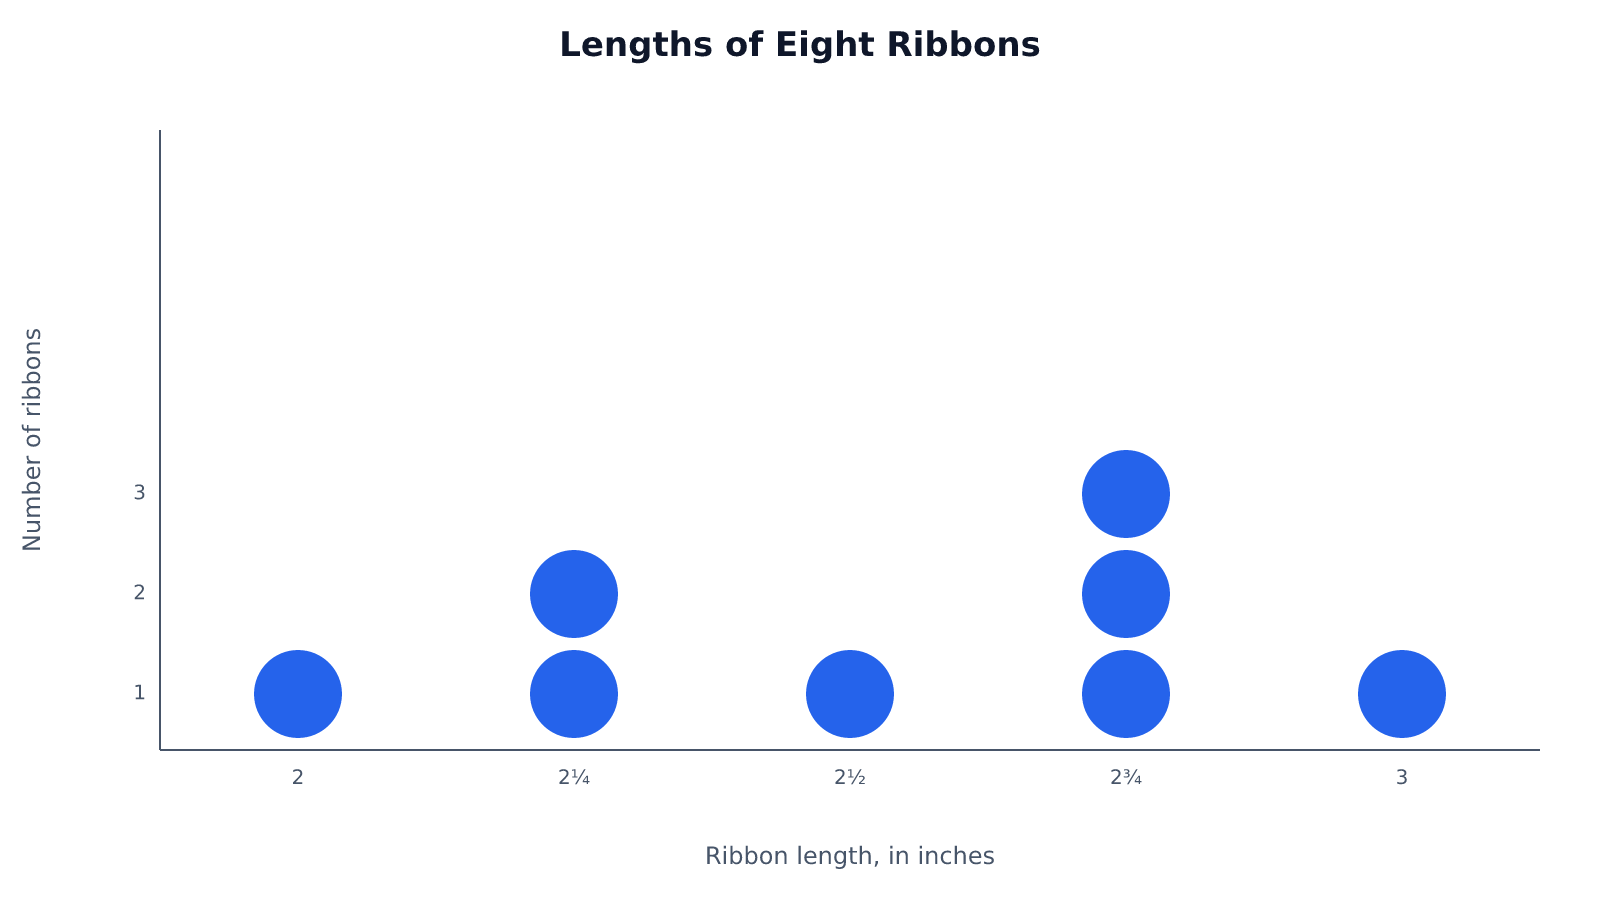
Ribbon length, in inches. Each mark represents one ribbon.
Now add a ribbon measuring 2⅜ inches. It lands between the quarter-inch ticks at 2¼ and 2½. Rounding it to either tick would change the observation merely to suit the drawing.
Instead, subdivide the scale into eighths. The new ribbon gets an exact position, and all the original measurements still fit because halves and quarters can also be written as eighths.
Lengths of Nine Ribbons, Including the New 2⅜-Inch Ribbon
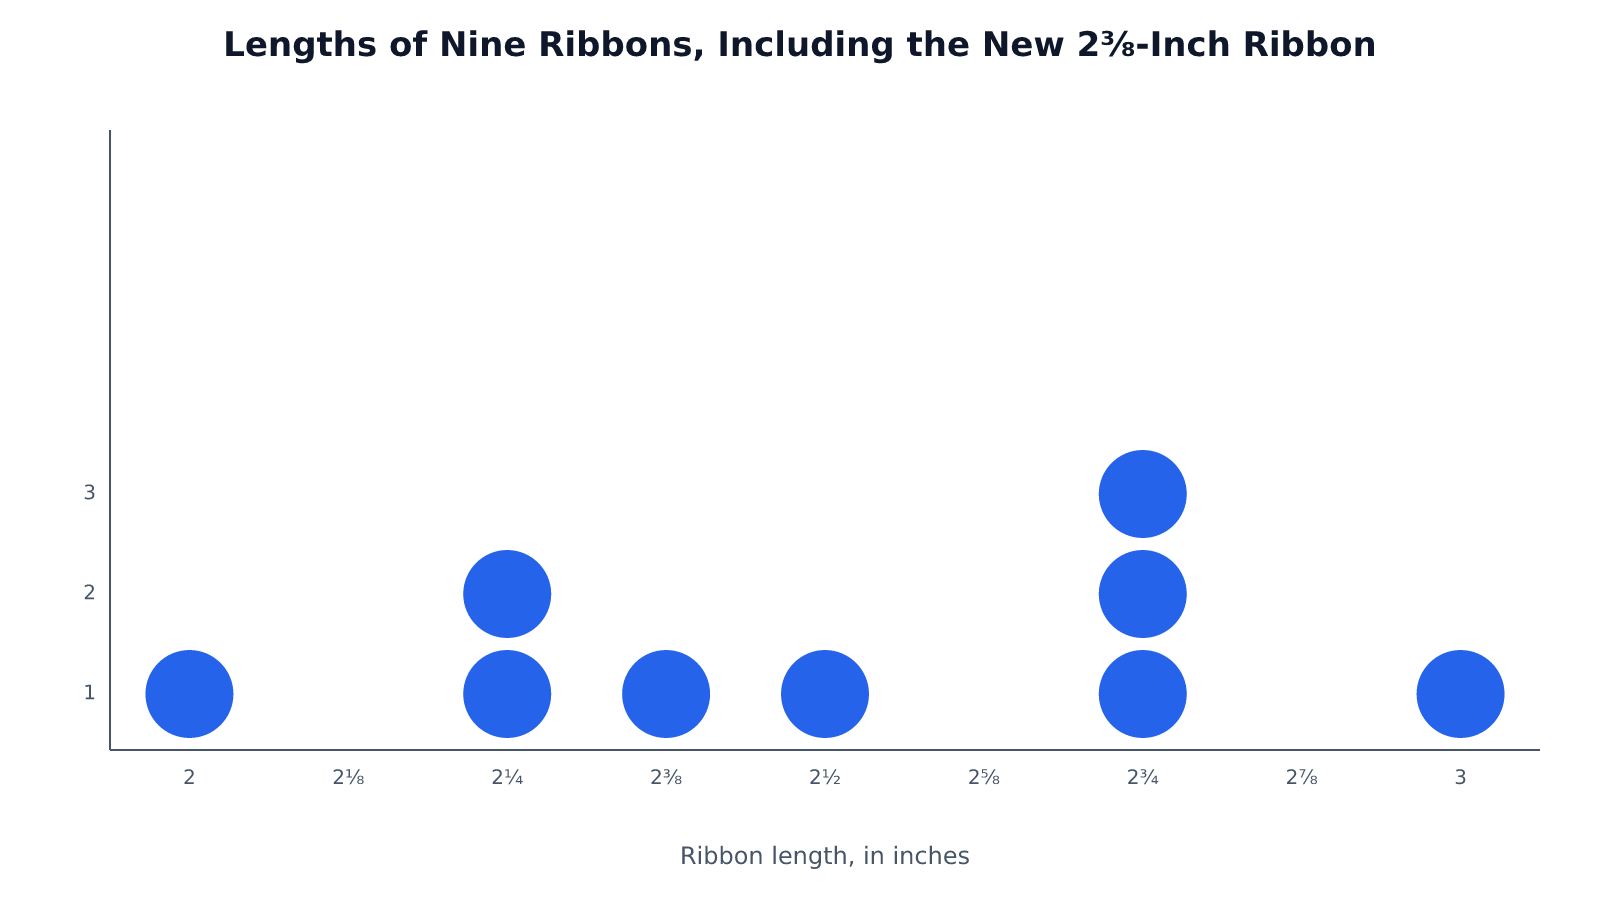
Ribbon length, in inches. Each mark represents one ribbon.
Choose a common subdivision that accommodates every recorded fraction; the data determine the spacing. The calculations below use the original eight ribbons, not this expanded set.
Find the Mode, Median, and Range
Return to the original eight ribbons. Their median is 2⅝ inches, even though no ribbon in the list has that length. That is the surprise: a calculated center need not be an observed value.
To see where it comes from, count the marks from left to right, including every mark in each stack. With eight observations, the two middle positions are the fourth and fifth. The average of 2½ and 2¾ inches is 2⅝ inches. An odd-sized data set has just one middle observation, so no averaging is needed.
The mode answers a different question: which recorded length occurs most often? Here, the tallest stack belongs to 2¾ inches, with three ribbons. Unlike the median in this example, the mode is a length you actually measured.
The range describes the spread between the outermost observations: 3 − 2 = 1 inch. Use the positions occupied by marks, even if your drawn scale extends beyond them. Extra drawing space cannot change the spread of the measurements.
Choose the Display and Avoid Misreadings
A line plot suits a modest numerical data set when exact observations matter. You can count measurements above a threshold without losing their individual values. If hundreds of distinct measurements crowd the scale, a histogram may communicate the overall distribution more clearly, at the cost of grouping values into intervals.
The question also determines whether you want a stacked dot plot or a connected line graph. The stacked display shows frequency; a connected line graph can show a plant’s height recorded each week. Choose the latter when the sequence of measurements matters. Because “line plot” can name either display, check how the term is being used.
Whichever question you ask, the drawing must preserve the numerical scale. Keep marks uniform, with consistent vertical spacing, so an oversized X does not suggest an extra observation. Keep unoccupied positions too. Removing 7 from the bean-pod scale would make the distance from 6 to 8 look like the distance from 8 to 9, distorting the measurements.
Key Takeaways
- Read a mark’s horizontal position for its value and the stack height for its frequency.
- Transfer repeated measurements separately; each needs its own mark.
- Let recorded fractions determine the scale’s subdivision.
- Distinguish a calculated center from a value actually observed.
- Preserve gaps so the display preserves numerical distances.
Frequently Asked Questions
What Is a Line Plot vs. Line Graph?
In elementary math, a line plot usually means stacked marks showing frequencies above a number line. A line graph connects points to show a relationship, often change over time; it may also be called a line plot in visualization software. If the same height was recorded in several weeks, a frequency stack would retain the count but lose which week each measurement came from.
What Is a Line Plot Best Used For?
A line plot is best for a relatively small numerical data set whose exact values and repetitions matter. Classroom measurements suit it well because you can answer questions about particular lengths without first combining them into broader intervals.
Can Halves, Quarters, and Eighths Appear on the Same Scale?
Yes, halves, quarters, and eighths can share a scale divided into eighth-unit steps. One-half equals four-eighths, and one-quarter equals two-eighths. Labels may use those equivalent forms without changing where the marks belong.
How Do I Find the Median When Several Marks Share a Value?
Count each mark separately when locating the middle position or positions, even within one stack. If both middle marks in an even-sized data set fall in the same stack, their average is simply that stack’s value. Repetition does not require you to move to the next distinct value.
Does an Empty Tick Mean the Value Is Zero?
No, an empty tick means the frequency at its labeled value is zero. A measured value of zero would have its own mark above a tick labeled 0. The tick label and the number of marks answer different questions.
Turn Measurements Into Countable Evidence
Check your finished plot against the recorded list: every observation should have one mark, repeated values should share a stack, and every mark should sit at its exact value. Count the marks once more before using the display to answer questions.
Recommended for you
Scatter Plot Reading: Steepness Isn’t the Whole Story
A scatter plot's slope can look persuasive while its dots tell another story. Learn to judge strength, clusters and display choices. Read the article.
A Circle Graph’s Largest Slice Isn’t Always a Majority
Read a circle graph without mistaking the largest slice for a majority. Follow a 40-student survey from counts to percentages and angles. See how it works.
Bimodal Histogram: Two Peaks That One Average Can Hide
A bimodal histogram can reveal two operating conditions. Use the 15 and 25 millisecond test example to read the peaks and plan your next analysis. See how.
Money Market Graph: The Cash Squeeze Behind Rate Rises
A money market graph links cash needs to interest rates. Learn how to read its axes, find equilibrium and track supply or demand shifts. See the breakdown.
Frequency Histogram: Every Bar Traced to Its Scores
A frequency histogram shows how common scores are, not how high. Check interval boundaries, trace bars to scores, and avoid misreading the chart. See how.

15 Venn Diagram Examples: Shared vs. Exclusive Members
Venn diagram examples clarify shared and exclusive members, from fruit baskets to an 80-person pet survey. Avoid double-counting; explore all 15 examples.

Stem and Leaf Plot: Ordered Data, Every Value Visible
A stem and leaf plot keeps each value visible while sorting reading times into rows. Learn to build one, find the middle, and spot patterns. See how it works.

How to Make an Infographic: A Worked Canva Example
Learn how to make an infographic in Canva, from a clear brief to a readable design, using a fictional maintenance log. Follow the step-by-step walkthrough.