
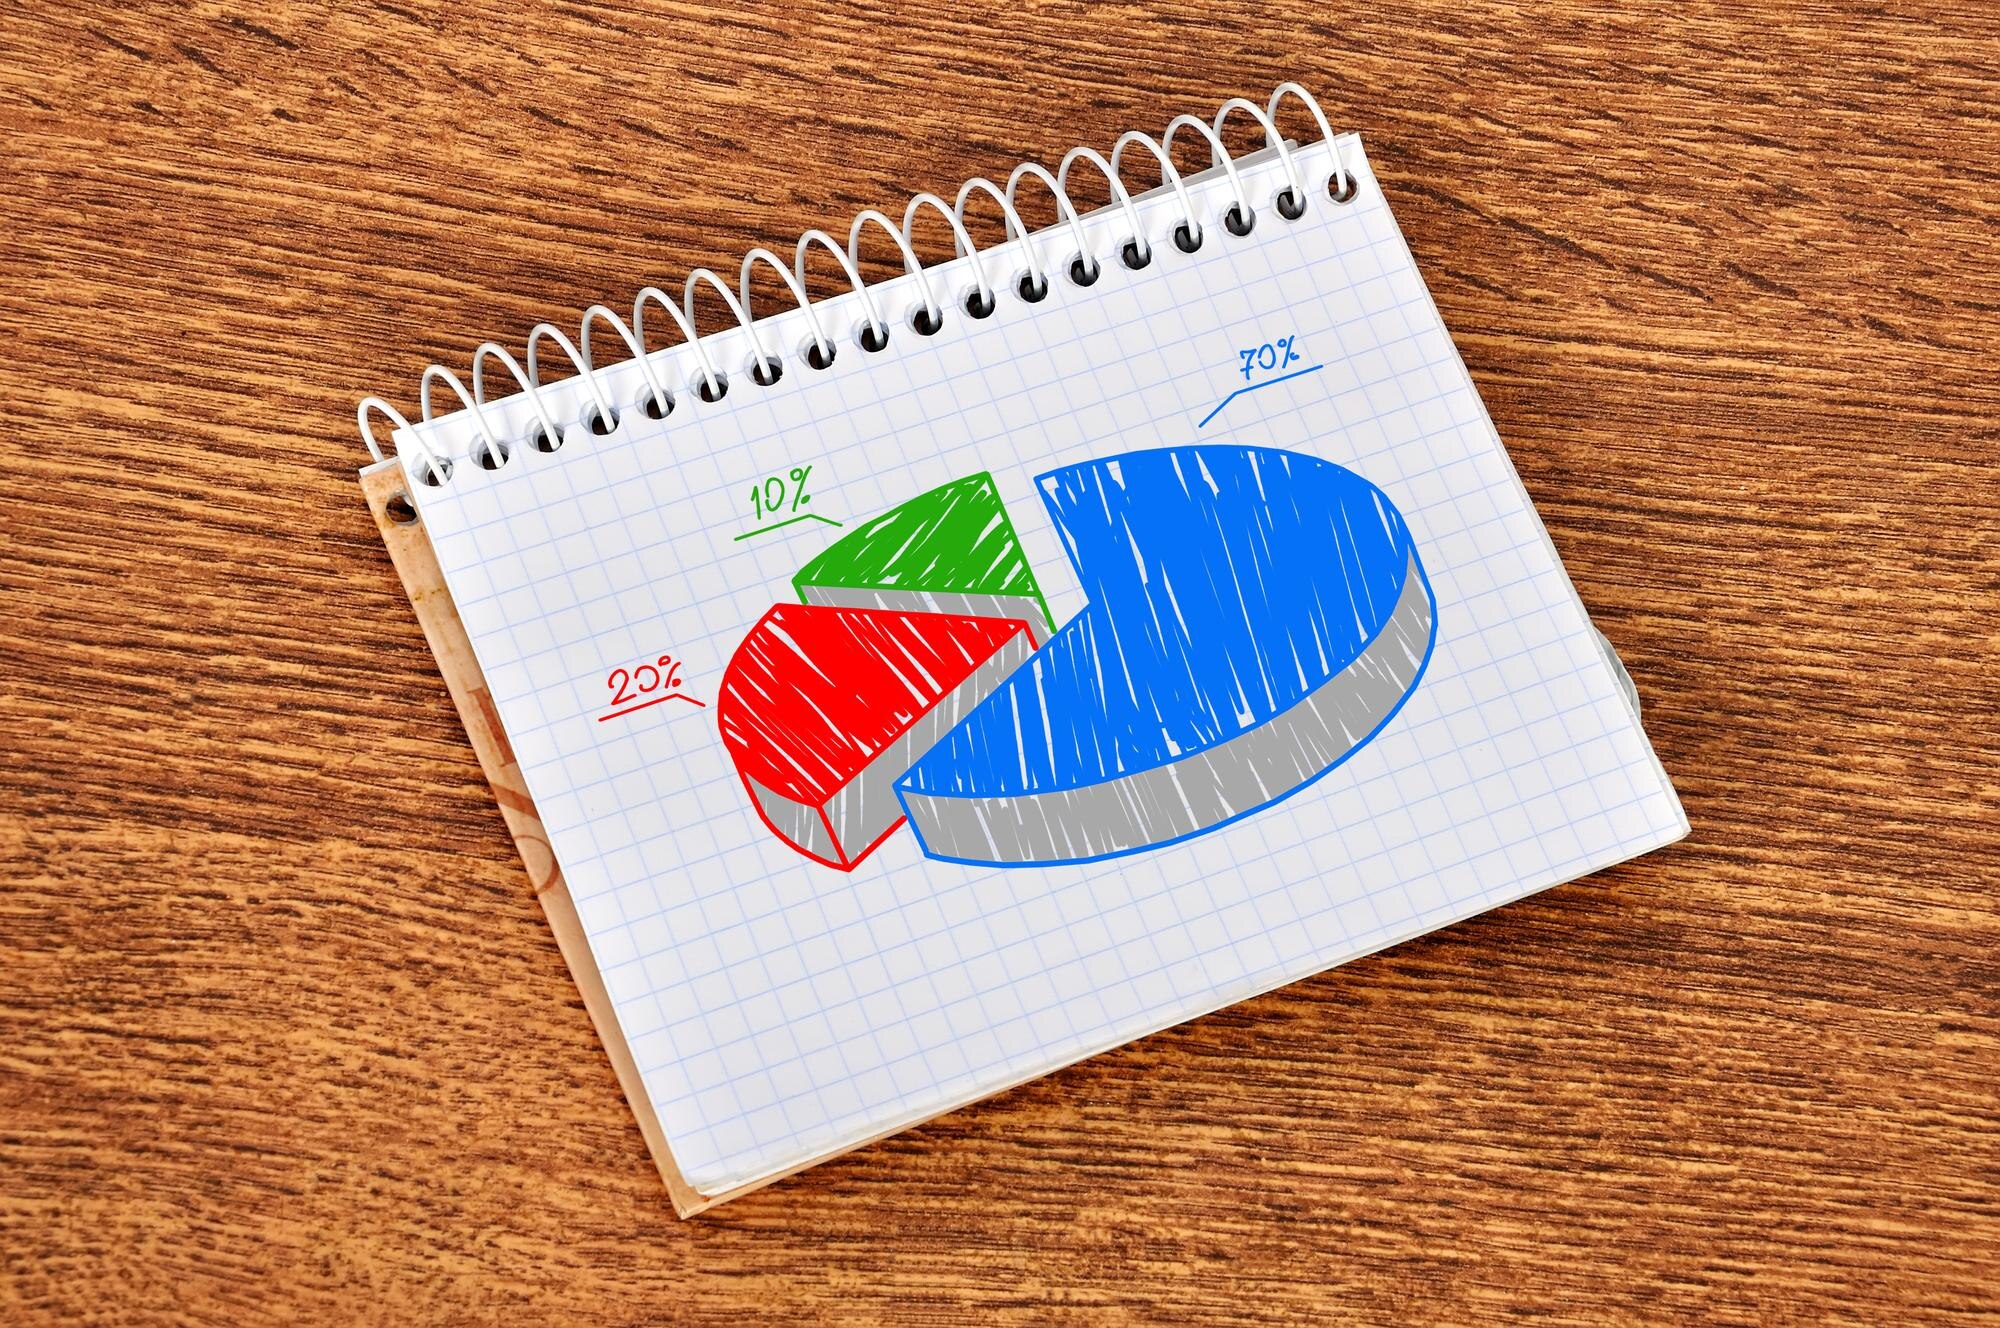

A circle graph shows how one whole divides into categories, with each slice sized to match its share. Its largest slice can still represent less than half the group: winning against the other slices is not the same as winning a majority. This guide follows a student survey from counts to percentages and angles, then shows how to draw it without leaving a stray wedge. Misread the slices, and the biggest group can look like most of the group.
In This Article
- Understand What the Whole Represents
- Read Labels Before Comparing Slices
- Find Counts From Percentages
- Calculate the Angle for Each Slice
- Read Percentages From Angles
- Draw and Label Your Graph
- Know When Another Graph Works Better
- Key Takeaways
- Frequently Asked Questions
- Turn Counts Into Clear Shares
Understand What the Whole Represents
A circle graph, also called a pie chart, represents 100% of the data included. Suppose 40 students each choose one favorite activity: drawing, music, reading, or games. Each student contributes one response, so the categories divide the group without overlap.
Overlap can break that picture. In a different survey allowing several choices, suppose drawing gets 60%, music 40%, reading 25%, and games 15%. Those labels total 140%. Draw them at their stated sizes and they exceed one full circle. Squeeze them into one circle and the areas no longer match the labels.
The problem is the whole, not the compass. Multiple-choice responses could form a graph of total selections, but its slices would then describe selections, not percentages of students. The title must say which whole you mean.
Read Labels Before Comparing Slices
In our single-choice survey, drawing receives 16 votes, music receives 10, reading receives 8, and games receives 6. Read the title and sample size, then match the labels to their slices. A color key identifies categories; it does not tell you their values.
Those values give drawing a plurality: more votes than any other individual choice. A majority means more than half, and 16 of 40 does not qualify. The visual punchline is simple: combine all the other slices, and drawing loses. When reading circle graphs, compare the biggest slice with the rest of the circle before calling it a majority.
Find Counts From Percentages
To find a percentage, use percentage = category count ÷ total × 100. Drawing gives 16 ÷ 40 × 100 = 40%; reading gives 8 ÷ 40 × 100 = 20%.
To recover a count, use category count = percentage ÷ 100 × total. The games label of 15% gives 15 ÷ 100 × 40 = 6 students.
That clean result depends on an exact label. A rounded label can give a fractional count even though each student contributes one response. The displayed percentage has lost precision, so reversing the calculation does not necessarily recover an exact count.
Calculate the Angle for Each Slice
A full turn measures 360°. Use sector angle = category count ÷ total × 360°. For music, 10 ÷ 40 × 360° = 90°. If you already have an exact percentage, divide it by 100 and multiply by 360° instead. Keep unrounded values until the final measurement.
Circle graph slice angles for a 40-response survey
| Survey category | Responses (out of 40) | Share of responses | Angle calculation | Circle graph slice angle |
|---|---|---|---|---|
| Music | 10 | 25% | 10 ÷ 40 × 360° | 90° |
| Drawing | 16 | 40% | 16 ÷ 40 × 360° | 144° |
| Reading | 8 | 20% | 8 ÷ 40 × 360° | 72° |
| Games | 6 | 15% | 6 ÷ 40 × 360° | 54° |
Together, the four angles complete the 360° circle.
Read Percentages From Angles
An angle can also test whether a slice matches its label. Use percentage = sector angle ÷ 360° × 100. Suppose someone redraws the survey with a 108° music slice but keeps its 25% label. The angle gives 108 ÷ 360 × 100 = 30%. The picture and label disagree.
That disagreement is easier to spot with benchmarks: each 1% corresponds to 3.6°, so 90° means 25%, 180° means 50%, and 270° means 75%. In these circle graph examples, measuring at the center tests the actual share; estimating the curved edge by eye does not give the same precision.
Draw and Label Your Graph
The classic drawing failure appears at the end: every category has a slice, yet a thin wedge remains. Do not stretch the last category to swallow it. First add your calculated angles. If they complete the full turn, the error is in the drawing; if they do not, revisit the arithmetic or rounding.
To avoid that gap, draw a circle with a compass and mark its center. Draw a starting radius. Place the protractor’s center on the marked point, align its baseline with the radius, and measure a 90° sector for Music. Draw its boundary. Continue in the same direction with Drawing (144°), Reading (72°), and Games (54°), aligning the protractor with each new boundary before measuring the next sector. Angles belong at the shared center, not on the outside edge.
The final boundary should meet the starting radius. Before coloring, inspect that join. Then add category names and percentages, with the survey total near a descriptive title. Move labels outside narrow slices when needed. Color helps, but written labels must carry the meaning without it.
Know When Another Graph Works Better
A circle needs nonnegative values that form a meaningful whole. A negative account balance cannot occupy a negative area, and unrelated measurements do not become useful shares merely because you add them. Our survey works because its categories divide one defined set of responses.
Even with a valid whole, bars may serve the question better. Comparing several classes or distinguishing nearly equal shares is easier with bar lengths on a common baseline than with small differences between sectors. Many categories also make a circle crowded. If you choose a circle, keep it flat: 3-D perspective can make a front slice appear larger than an equal slice at the back.
Key Takeaways
- Define the whole before assigning slices.
- Separate the largest category from a majority.
- Use the total to turn percentages back into counts; rounded labels may yield estimates.
- Convert each share into its part of a full turn.
- Resolve a leftover wedge before adding labels or color.
Frequently Asked Questions
The questions below cover cases where a finished chart leaves information missing or rounds it away.
What Is a Circle Graph?
A circle graph displays categories as proportional slices of one whole. “Pie chart” names the same graph type; neither name changes how the shares are calculated.
How Do You Make a Circle Graph Step by Step?
Add the category counts, calculate their shares and angles, then draw and label the sectors around one center. Use the angle table as your drawing plan, and settle any gap before finishing the graph.
Can You Recover Exact Counts If the Chart Does Not Show the Total?
No, not from percentages alone: they describe proportions without specifying group size. Half the responses could mean 5 out of 10 or 50 out of 100. You need the total or equivalent additional information.
Why Might Rounded Slice Percentages Add Up to 99% or 101%?
Independently rounding each slice can make the displayed total 99% or 101% even when the exact shares fill the circle. Calculate angles from original counts when available, rather than adjusting a slice to fit rounded labels.
How Can You Find a Missing Percentage Label?
If the known percentages are exact, subtract their sum from 100%. Exact labels totaling 82% leave 18% for the remaining slice. If the labels are rounded, the remainder is only an estimate. Subtraction finds one missing share, but cannot separate several unlabeled slices without more information.
Turn Counts Into Clear Shares
Use half the circle as your first visual checkpoint. In the student survey, drawing is the biggest category, yet it does not reach that halfway mark.
For your own data, first decide whether the question concerns parts of one whole or differences between values. Choose a circle for the first job and bars for close comparisons. If a circle fits, work from counts before drawing, and keep the angle table beside your protractor.
Recommended for you
Dot Plot Explained: What Each Stacked Dot Tells You
A dot plot puts each observation above a number line. Learn how stacked dots show frequency and why equal spacing matters. See the study-time example.
Tree Diagram Rules: Clear Branches, No Loops Allowed
Learn how a tree diagram connects roots, children and leaves, then follow paths and calculate probabilities without confusing it with a flowchart. Read more.
Bubble Chart Accuracy: Why Area Matters More Than Radius
A bubble chart can turn a fourfold rise into a sixteenfold area. Learn to read axes and size, avoid misleading circles, and choose a design. See the guide.
Right vs Left Skewed Histogram: What the Tail Reveals
A right vs left skewed histogram is named for its tail, not its tallest bars. Avoid reversed readings and check averages and binning. Explore the guide.

Turning Data into Stories: The Psychology of Visual Complexity
A network map with 1,200 nodes feels mesmerizing until your eyes start to swim; a five-bar chart can feel banal yet instantly graspable. The gap between awe and overload is not just taste—it’s how our visual and cognitive systems negotiate complexity, novelty, and control. If you want to use complex visuals to create connection and […]
Symmetric Histogram: Balance Beyond the Tallest Bar
A symmetric histogram mirrors bars around a center, not always its tallest peak. Compare tails and see how bin boundaries affect balance. Read the example.

How to Find a Hobby That Truly Fits You
Give a hobby 21 days and 90 minutes per week, and you will learn more about your motivation, stress triggers, and attention than a dozen personality quizzes. A few concrete moves—testing a novel, a 5‑aside game, or a few low-stakes rounds of online gameplay—can reveal which activities calm your nervous system, sharpen focus, and actually […]
Explained: How to Read a Histogram, From Axes to Area
Learn how to read a histogram using book-length examples. Check axes, interpret counts, and see why unequal bin widths need area. Read the walkthrough.