
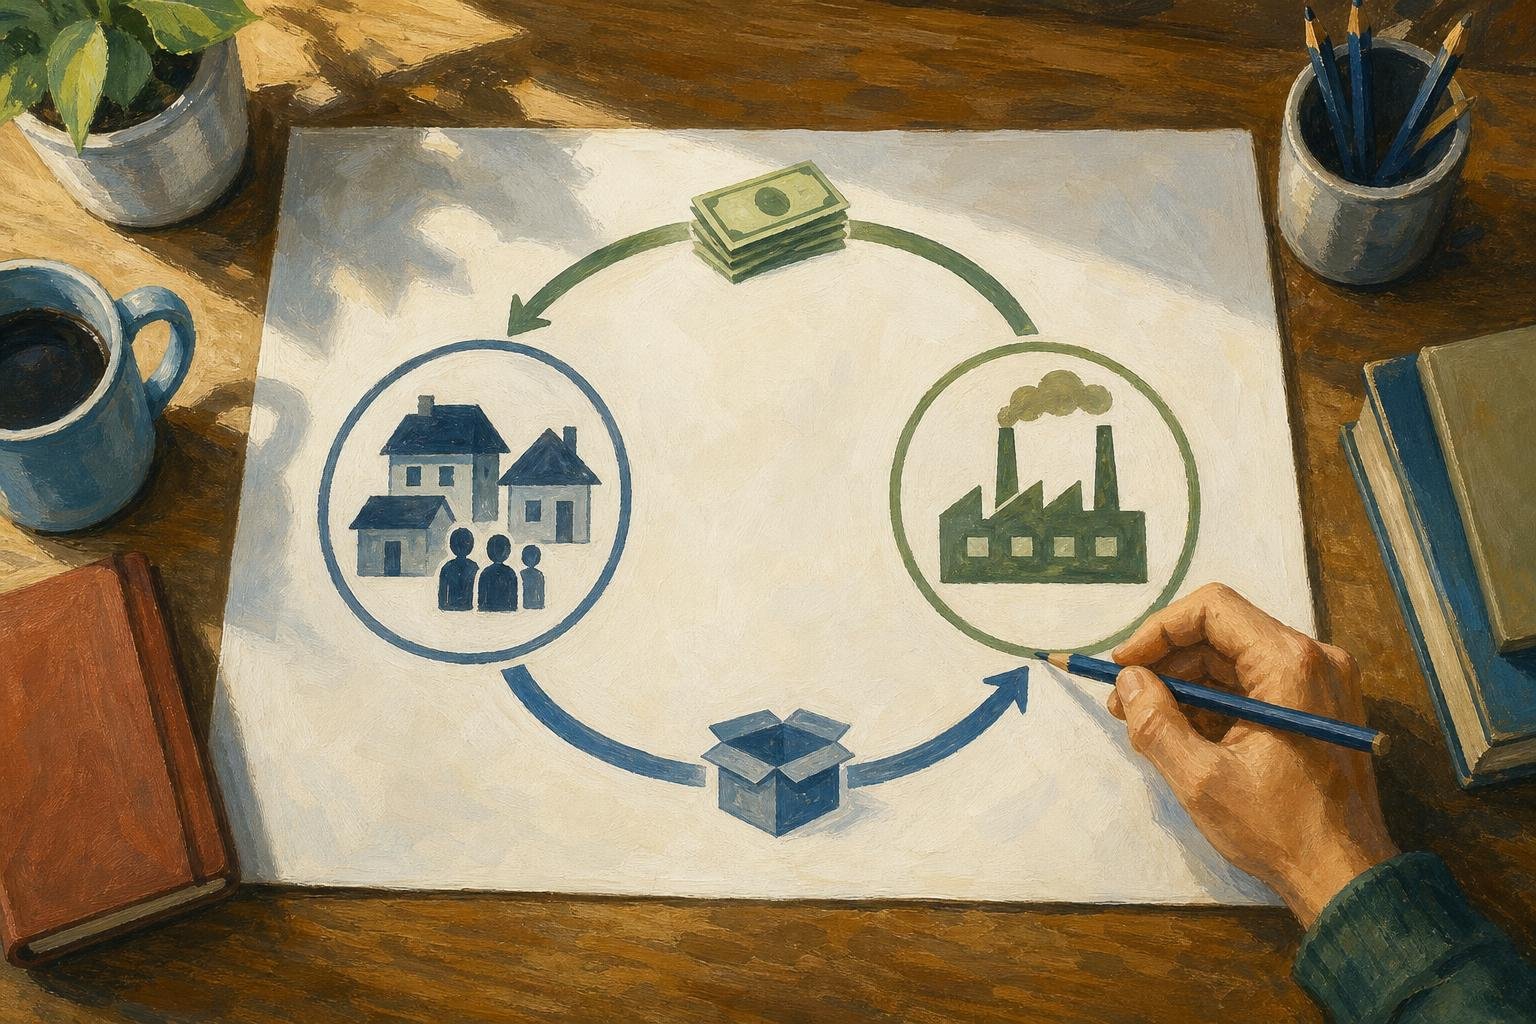

A bakery hands a household a loaf of bread, and the household hands over $4: a circular flow diagram shows that exchange alongside the work and income that make it possible. Goods and resources travel one way; their money payments travel the other.
The simplest diagram connects households and firms through two markets. Expanded versions add government, financial activity, and foreign trade. For product- and factor-market exchanges, ask: what changes hands, and what payment goes the other way? Taxes and transfers have no direct reciprocal exchange. Interpret financial flows separately rather than assuming a matching real flow.
In This Article
- How Households and Firms Exchange
- Read the Arrows in the Diagram
- Match Resources With Their Payments
- Add Government and Foreign Trade
- Follow Saving and Investment
- Connect Spending to National Income
- Know What the Basic Model Leaves Out
- Key Takeaways
- Frequently Asked Questions
- Start With One Household Transaction
How Households and Firms Exchange
Follow a bakery worker through the shop door. During a shift, the worker supplies labor and earns a paycheck. After the shift, the worker buys bread to take home. The person has switched roles: first supplying something the bakery needs, then buying something it produces. The bakery switches roles too, from employer to seller.
Those two transactions give the circular flow model its two markets. The worker’s shift belongs in the factor market, where households supply productive resources to firms. The bread purchase belongs in the product market, where firms sell finished goods and services to households. Keep the worker’s two roles separate and the market labels become easier to follow.
Neither market needs a stall or shop counter. The paycheck could arrive by direct deposit and the bread order could be placed online. A worker could also own part of the bakery: households and firms describe roles in an exchange, so the same person can participate on both sides.
Read the Arrows in the Diagram
The worker’s two roles appear in separate pairs of arrows below. Read the upper pair as the bread purchase and the lower pair as the work exchange. Repeated labels refer to the same households and firms.
MONEY: Households ── spending ──▶ Product Markets ── sales revenue ──▶ Firms
REAL:  Households ◀─ goods/services ── Product Markets ◀─ goods/services ── Firms

REAL:  Households ── resources ──▶ Factor Markets ── resources ──▶ Firms
MONEY: Households ◀─ income ───── Factor Markets ◀─ factor payments ── Firms
The upper money arrow starts at the household because the customer pays. The lower money arrow starts at the firm because the employer pays. Identify the payer before tracing each money arrow.
Circular flow diagram: real flows versus money flows by market
| Flow in the circular flow model | Flow type | Market | Direction | Concrete example |
|---|---|---|---|---|
| Goods and services | Real: finished output | Product market | Firms → households | A bakery supplies 1 loaf of bread to a household |
| Consumption expenditure | Money: payment for output | Product market | Households → firms | The household pays the bakery $4 for that loaf |
| Factors of production | Real: productive resources | Factor market | Households → firms | A household member supplies 1 hour of labor to the bakery |
| Factor income | Money: payment for resources | Factor market | Firms → households | The bakery pays the worker $20 for that hour of labor |
Bread makes the real-flow arrow easy to recognize, but services belong there too. Replace the loaf with a haircut and the directions stay the same: the household receives the service and pays the firm.
Match Resources With Their Payments
The worker’s wage is only one payment the bakery makes. Suppose the bakery rents its site from a retired shopkeeper and borrows from a local bank to buy an oven. The shopkeeper receives rent; the bank receives interest. The owner organizes production and bears the business risk, receiving whatever profit remains after relevant costs. That remainder can be negative.
These arrangements put the standard introductory categories to work: land earns rent, labor earns wages, capital earns interest, and entrepreneurship earns profit. Land includes natural resources, while labor covers human effort in production. Households contribute through ownership as well as work, sometimes through other organizations.
The borrowed funds and the oven serve different purposes. The oven is produced capital, like the bakery’s delivery equipment; the loan finances its purchase. Payment arrangements can cross the introductory categories: an equipment owner may collect lease payments while a lender collects interest. Follow the particular contract to identify who receives the payment.
Add Government and Foreign Trade
Now suppose a government agency buys bread for a public facility. The bakery receives payment for current output. If the government instead pays a benefit to an eligible household, that payment is a transfer. The household may later spend it at the bakery, but the government has not bought bread through the transfer itself.
Taxes connect the bakery and its workers back to government. Government also employs workers and supplies public services, so an expanded diagram includes more than a single spending arrow.
Foreign trade adds another customer or supplier. Suppose the bakery imports an oven: its customs declaration describes equipment arriving from abroad, while its payment goes to the foreign supplier. If the bakery sells bread abroad, the payment comes from an overseas customer and the bread is an export.
The imported oven helps explain why the circular flow of the economy needs a domestic boundary. The bakery uses the oven at home, but the oven itself was produced abroad. Production belongs where it occurs, regardless of the owner’s nationality. That distinction becomes important when spending is used to measure domestic output.
Follow Saving and Investment
The worker need not spend the whole paycheck at the bakery or any other business. Some income goes into saving, some goes to taxes, and some purchases pay for imports. These are leakages from the circuit of spending on domestic consumer goods. Investment, government purchases, and exports add spending to domestic production and are called injections.
Saving introduces a financial connection. Banks and securities markets channel funds toward borrowers and asset purchases, but a deposit does not automatically produce an equal amount of new business investment immediately. Borrowers still have to decide to spend, and financing conditions affect those decisions. A household building an emergency fund reduces current consumption without determining what someone else will buy next.
The table locates each connection and gives a separate example for it.
Circular flow diagram: leakage exits and injection entry points
| Flow | Circular flow role | Where the flow leaves or enters | Concrete spending or income example |
|---|---|---|---|
| Saving (S) | Leakage | Household income → saving through financial institutions or asset holdings, rather than consumption | A household saves $200 of its disposable income instead of spending it. |
| Net taxes (T) | Leakage | Households and firms → government; taxes are measured net of transfers | A household pays $300 in taxes and receives $100 in transfers: net leakage is $200. |
| Imports (M) | Leakage | Domestic buyers → foreign producers, diverting spending from domestic output | A household buys an imported phone; the import value is spending on foreign output. |
| Investment (I) | Injection | Capital purchasers → producers of new capital goods; inventory accumulation also counts | A bakery buys a newly produced domestic oven for $5,000. |
| Government purchases (G) | Injection | Government → producers supplying goods and services; transfers are excluded | A government pays a domestic contractor $20,000 for road repairs. |
| Exports (X) | Injection | Foreign buyers → domestic producers | An overseas customer pays a domestic manufacturer $2,000 for machinery. |
The domestic oven purchase in the table counts as investment because it pays for newly produced capital. Buying an existing stock or bond is a financial transaction; changes in inventories also count as investment in national accounting. Keep financing separate from spending on current production, even when one helps fund the other.
Connect Spending to National Income
Current production brings the arrows together in Gross Domestic Product (GDP), the value of final goods and services produced within an economy during a given period. Production generates income for its contributors, and the resulting output is purchased or held as inventory. The circular flow of income model connects those views of the same activity.
On the expenditure side, the identity is:
GDP = C + I + G + (X − M)
Here, C is household consumption, I is gross private domestic investment, and G is government consumption and gross investment. X represents exports and M represents imports. National accounts use detailed valuation rules to compare expenditure and income consistently.
Imports are subtracted because consumption, investment, and government purchases can include foreign-produced items. The imported oven can appear in investment, but its foreign-produced value is removed through imports. This correction keeps the measure domestic; it does not say that every imported purchase causes an equal fall in domestic output.
The word “final” prevents a different counting error. Flour sold to the bakery becomes an intermediate input when the bakery uses it to make bread for a household. Accountants can add the value created at each production stage or count the final loaf. Adding the full flour sale to the full bread sale would count the flour twice.
Know What the Basic Model Leaves Out
Bakery workers can stand idle while ovens stay cold, even when every recorded payment has a matching receipt. Balanced accounts do not imply full employment. The diagram organizes transactions; explaining why customers stopped buying requires information about spending behavior and conditions beyond those arrows.
That gap separates an accounting identity from a causal explanation. The GDP identity holds by definition, but it does not establish which change caused another. Explaining business cycles or economic growth requires more information, including productivity and responses to changing conditions.
The simplest two-sector diagram also assumes household income returns through consumption, leaving out saving alongside government and foreign trade. Its spending arrows do not separate price increases from increases in quantities purchased. And the arrows measure flows over a period, such as a year: annual income fits on an arrow, while wealth at year-end is a stock measured at one moment.
Key Takeaways
- Separate the worker’s role as a resource supplier from the same person’s role as a customer.
- Identify the payer to establish a money arrow’s direction; in product- and factor-market exchanges, the corresponding real flow runs the other way.
- Distinguish a government purchase of bread from a transfer that a household may later spend.
- Use the leakage-and-injection connections to follow income beyond household consumption.
- Count final domestic output once when connecting expenditure with national income.
Frequently Asked Questions
The bakery example also helps resolve common questions about which arrows belong in a diagram.
What are two types of circular flow?
The two types are real flows and money flows. The loaf moving to the household is a real flow; the household’s payment is a money flow. They describe opposite sides of the same purchase.
What is the circular flow model?
The circular flow model represents exchanges among economic sectors through markets. The bakery connects work with wages and bread with customer spending. It need not pay the worker with the exact dollars that worker previously spent there.
Are financial institutions a separate sector in every version?
No, financial institutions are a separate sector only in some versions. A diagram focused on the worker’s bread purchase can leave banks out, while one following the bakery’s loan can show them explicitly. Other diagrams represent finance through a saving-and-investment connection.
Does household saving permanently remove money from the economy?
No, household saving does not permanently remove money from the economy. A worker who deposits part of a paycheck has postponed consumption, while the deposit remains part of financial activity. Repaying debt or buying a security has different financial effects, so saving has no single automatic route back into spending.
Can the diagram reveal how income is distributed among households?
No, the basic diagram cannot reveal how income is distributed among households. Its household total combines the bakery worker’s wages with income received by owners and other workers. Comparing their circumstances requires income by household group and evidence about wealth ownership.
Start With One Household Transaction
Start with the worker’s bread purchase and test the diagram: cover the arrow labels and try to restore them from the direction of the exchange. Then repeat with the worker’s shift. Check that each label names what moves, that money and real flows run in opposite directions, and that each exchange passes through the appropriate market.
Recommended for you
Neural Network Diagram: Labels That Explain the Output
Read a neural network diagram without confusing scores with probabilities. Learn how arrows, layers, and activation labels clarify outputs. See the article.

What Is a Diagram? Explanation, Not Just Illustration
What is a diagram? Learn how labeled shapes and connecting lines explain relationships, how diagrams differ from drawings, and how to read one. Read on.
Box Plot Reading: A Shorter Box Doesn’t Mean Faster
A box plot shows center and spread, not speed alone. Use task-time examples to compare medians and variability on the same scale. See the worked example.

Symmetric Histogram: Balance Beyond the Tallest Bar
A symmetric histogram mirrors bars around a center, not always its tallest peak. Compare tails and see how bin boundaries affect balance. Read the example.

Inside a Violin Plot: Same Median, Different Shapes
A violin plot can reveal different bill patterns behind the same median. Learn how shape, points, and smoothing affect comparisons. See the restaurant example.

Flowchart Examples With Labels You Can Make Your Own
Adapt flowchart examples for online orders, leave requests, and login recovery with named actions, decisions, and outcomes. See reusable paths in the article.
Scatter Plot Reading: Steepness Isn’t the Whole Story
A scatter plot's slope can look persuasive while its dots tell another story. Learn to judge strength, clusters and display choices. Read the article.
Waterfall Chart: The Losses Behind a Positive Result
A waterfall chart reveals gains and losses behind net growth. Follow revenue from $500,000 to $580,000 and learn to read the floating bars. See the example.