
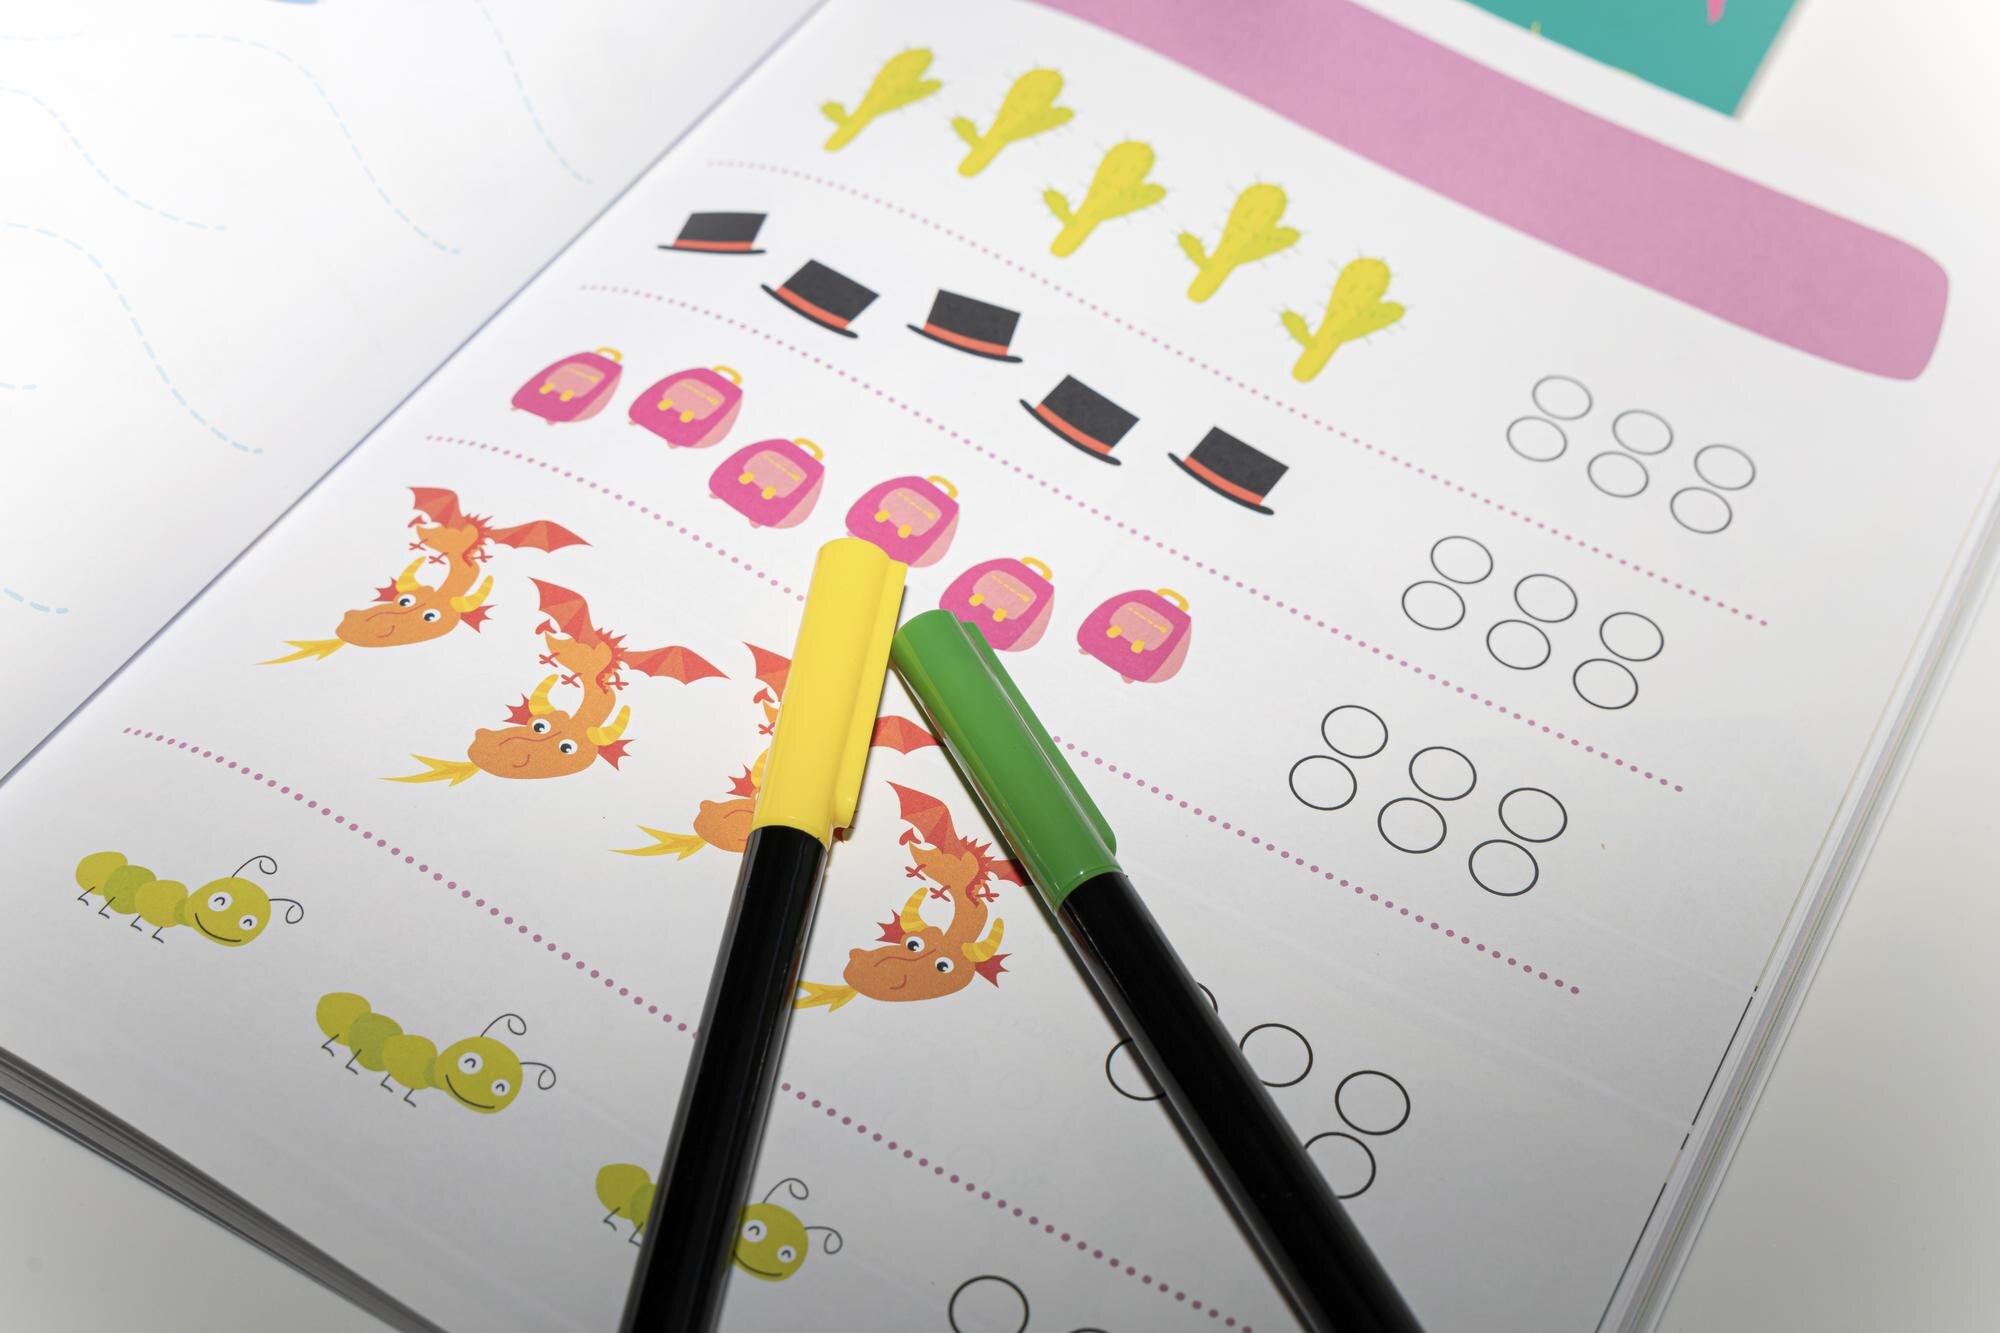

Four stars beside a library’s borrowing total can look like four books—until the key says each star stands for five. A picture graph uses repeated pictures or symbols to show counts in categories, so those four stars represent 20 books. The useful habit is to separate what you see from what it stands for before comparing amounts.
In This Article
- Read the Title and Labels
- Use the Key to Find Counts
- Work Through a Fruit Survey
- Compare Categories and Find Totals
- Read Partial Symbols and Empty Rows
- Make a Graph That Matches Your Data
- Key Takeaways
- Frequently Asked Questions
- Start With the Key
Read the Title and Labels
“Favorite Fruits in Our Class” tells you that the graph records preferences. A title such as “Fruit Served at Lunch” would describe a different count, even if both graphs used apple and banana pictures.
The labels narrow that topic into categories: Apples, Bananas, Grapes, and Oranges. They may sit beside rows or beneath columns. Read them alongside the title: in the favorites survey, a banana picture stands for students who chose bananas, not bananas in a lunchroom.
Use the Key to Find Counts
A library graph might place the key “One star represents 5 books” beneath rows of borrowing figures. The pictures are easy to spot; the small line assigning their value is easier to overlook. Four stars mean 4 × 5 = 20 books, even though there are only four marks on the page.
The confusing part is that a picture of one object can stand for several objects. A book-shaped symbol would still represent five books under that key. Its shape suggests the subject; the key supplies the count. Read “one star represents five books” as a single instruction before calculating.
Work Through a Fruit Survey
In this made-up survey, 18 students each chose exactly one favorite fruit: 8 chose apples, 6 chose bananas, 4 chose grapes, and none chose oranges. Circles count students; the labels identify their choices.
Favorite Fruits in Our Class
Key: ● = 2 students.
| Favorite Fruit | Symbols |
|---|---|
| Apples | ● ● ● ● |
| Bananas | ● ● ● |
| Grapes | ● ● |
| Oranges |
The circles need not resemble fruit. In picture graph examples, a simple repeated mark can keep the display clear without suggesting that bigger fruits deserve bigger symbols.
That display could also use one circle per student. The banana row would then need six circles instead of three, while recording exactly the same result. A change of key changes the display’s length, not the underlying data; it must apply to every row.
Compare Categories and Find Totals
Apples received the most votes. Their lead over bananas is 8 − 6 = 2 students, and the combined count for bananas and grapes is 6 + 4 = 10 students. These comparisons answer questions about particular choices.
A total raises a different question: what exactly are you adding? A vote total equals the number of participants only if everyone chose exactly once. The rule permitting one answer is what makes that conclusion possible.
If the survey allowed several choices, the same total would count selections. One student could contribute to both the apple and banana rows, so adding those rows would count that student twice. A multiple-choice survey is not inherently misleading, but calling its summed votes “students surveyed” would be. The graph needs the survey’s answering rule as well as its key.
Read Partial Symbols and Empty Rows
With the key below, three fully shaded squares represent 12 votes, and one half-shaded square represents 2 more, making 14 votes.
Votes for a Class Game (Made-Up Example)
Key: ■ = 4 votes; ◧ = 2 votes (a half-shaded square, assigned half the value of ■).
| Game | Symbols | Votes |
|---|---|---|
| Tag | ■ ■ ■ ◧ | 14 |
That half-shaded square must clearly show half its area shaded, with its meaning explained in the key. A smaller whole square leaves readers guessing whether it has a smaller value or was simply drawn badly. For readers who have not learned fractions, a smaller key can avoid that problem.
An empty row poses a different question: was the category included? Keeping Oranges in the fruit survey, with no circles beside it, records a choice that received no votes. Adding “0” makes that explicit; deleting the label loses that information.
Make a Graph That Matches Your Data
A stretched apple is a poor way to show a larger count. If one row has a small apple and another has a wider, taller one, the key no longer explains the visible difference. Keep symbols the same size and show extra observations with extra marks or clearly defined fractions.
The number of marks depends on your key. For counts of 10, 15, and 20, a symbol worth 5 produces whole-symbol rows without crowding the display. For counts of 3, 5, and 7, a value of 1 is simpler for beginners. Choose a key that fits both the counts and the reader.
Once that choice is made, align the rows and keep the spacing even. Give the graph a specific title and put the unit in the key, such as “students” or “books.” Then translate the finished symbols back into counts and compare them with your original data table. This catches a missing mark before it becomes a misleading result.
Key Takeaways
- Read the title to establish what is being counted.
- Use the key’s value, even when the symbol resembles a single object.
- Distinguish a total of selections from a total of participants.
- Make partial symbols unmistakable and keep zero-count categories visible.
- Build the graph from recorded counts, then read it back to catch errors.
Frequently Asked Questions
These questions cover the names used for this display and the marks most likely to cause confusion.
What is a picture graph?
A picture graph shows category counts through repeated pictures or symbols with a stated value. The pictures can resemble the subject, but the fruit survey’s circles show that recognizable objects are not required.
What’s the difference between a pictograph and a picture graph?
In elementary data lessons, “pictograph” and “picture graph” usually mean the same thing. Neither name means that each picture must equal one observation; the key determines that. Outside mathematics, “pictograph” can also mean a picture communicating an idea, such as a symbol on a sign, without numerical counts.
What does half a symbol represent when the key says one symbol equals four?
Half a symbol represents 2 observations when a full symbol represents 4. Two full symbols and one half-symbol therefore represent 10 observations, provided the partial mark is clearly shown as a half.
How should a category with zero observations appear?
A zero-count category should keep its label and have no symbols in its row or column. An optional “0” distinguishes an intentional empty row from one that might look unfinished.
Start With the Key
Try reading the fruit graph without looking at the survey figures above. Use the key to calculate each category’s count, then check your answers against those figures. Explain why three circles in the banana row represent six students rather than three.
Recommended for you
Quadratic Graph: One Worked Example, From Curve to Roots
Plot a quadratic graph using its vertex, symmetry and intercepts. Follow one worked example, explore shifts and recover an equation. See the key steps.
Dot Plot Explained: What Each Stacked Dot Tells You
A dot plot puts each observation above a number line. Learn how stacked dots show frequency and why equal spacing matters. See the study-time example.

Deep Reading in a Digital World: Stay Focused in an Age of Distraction
Your attention is outnumbered: surveys put daily phone pickups in the 50–150 range and notifications in the dozens, while a single interruption can cost several minutes to regain depth. If you want Deep Reading in a Digital World: How to Stay Focused in the Age of Distraction, you need a deliberate method, not willpower. This […]
Loanable Funds Graph: Cheaper Credit, Less Investment
A loanable funds graph shows why weaker investment demand can lower interest rates. Distinguish curve shifts from movements and trace the cause. See how.
Symmetric Histogram: Balance Beyond the Tallest Bar
A symmetric histogram mirrors bars around a center, not always its tallest peak. Compare tails and see how bin boundaries affect balance. Read the example.
Exponential Graph: Fixed Multipliers, Curved Results
An exponential graph multiplies outputs at equal input steps. Use points and the y=0 asymptote to sketch growth and decay curves. See the plotting steps.
Velocity vs Time Graph: Slope, Area and Reversed Motion
Read a velocity vs time graph using a runner and a reversing cart. Connect slope to acceleration and signed area to displacement. See how motion adds up.
Circular Flow Diagram: A $4 Loaf Links Two Markets
A circular flow diagram connects a $4 bread purchase to work and income. Learn how goods and money move through two markets. Follow the example in the article.