
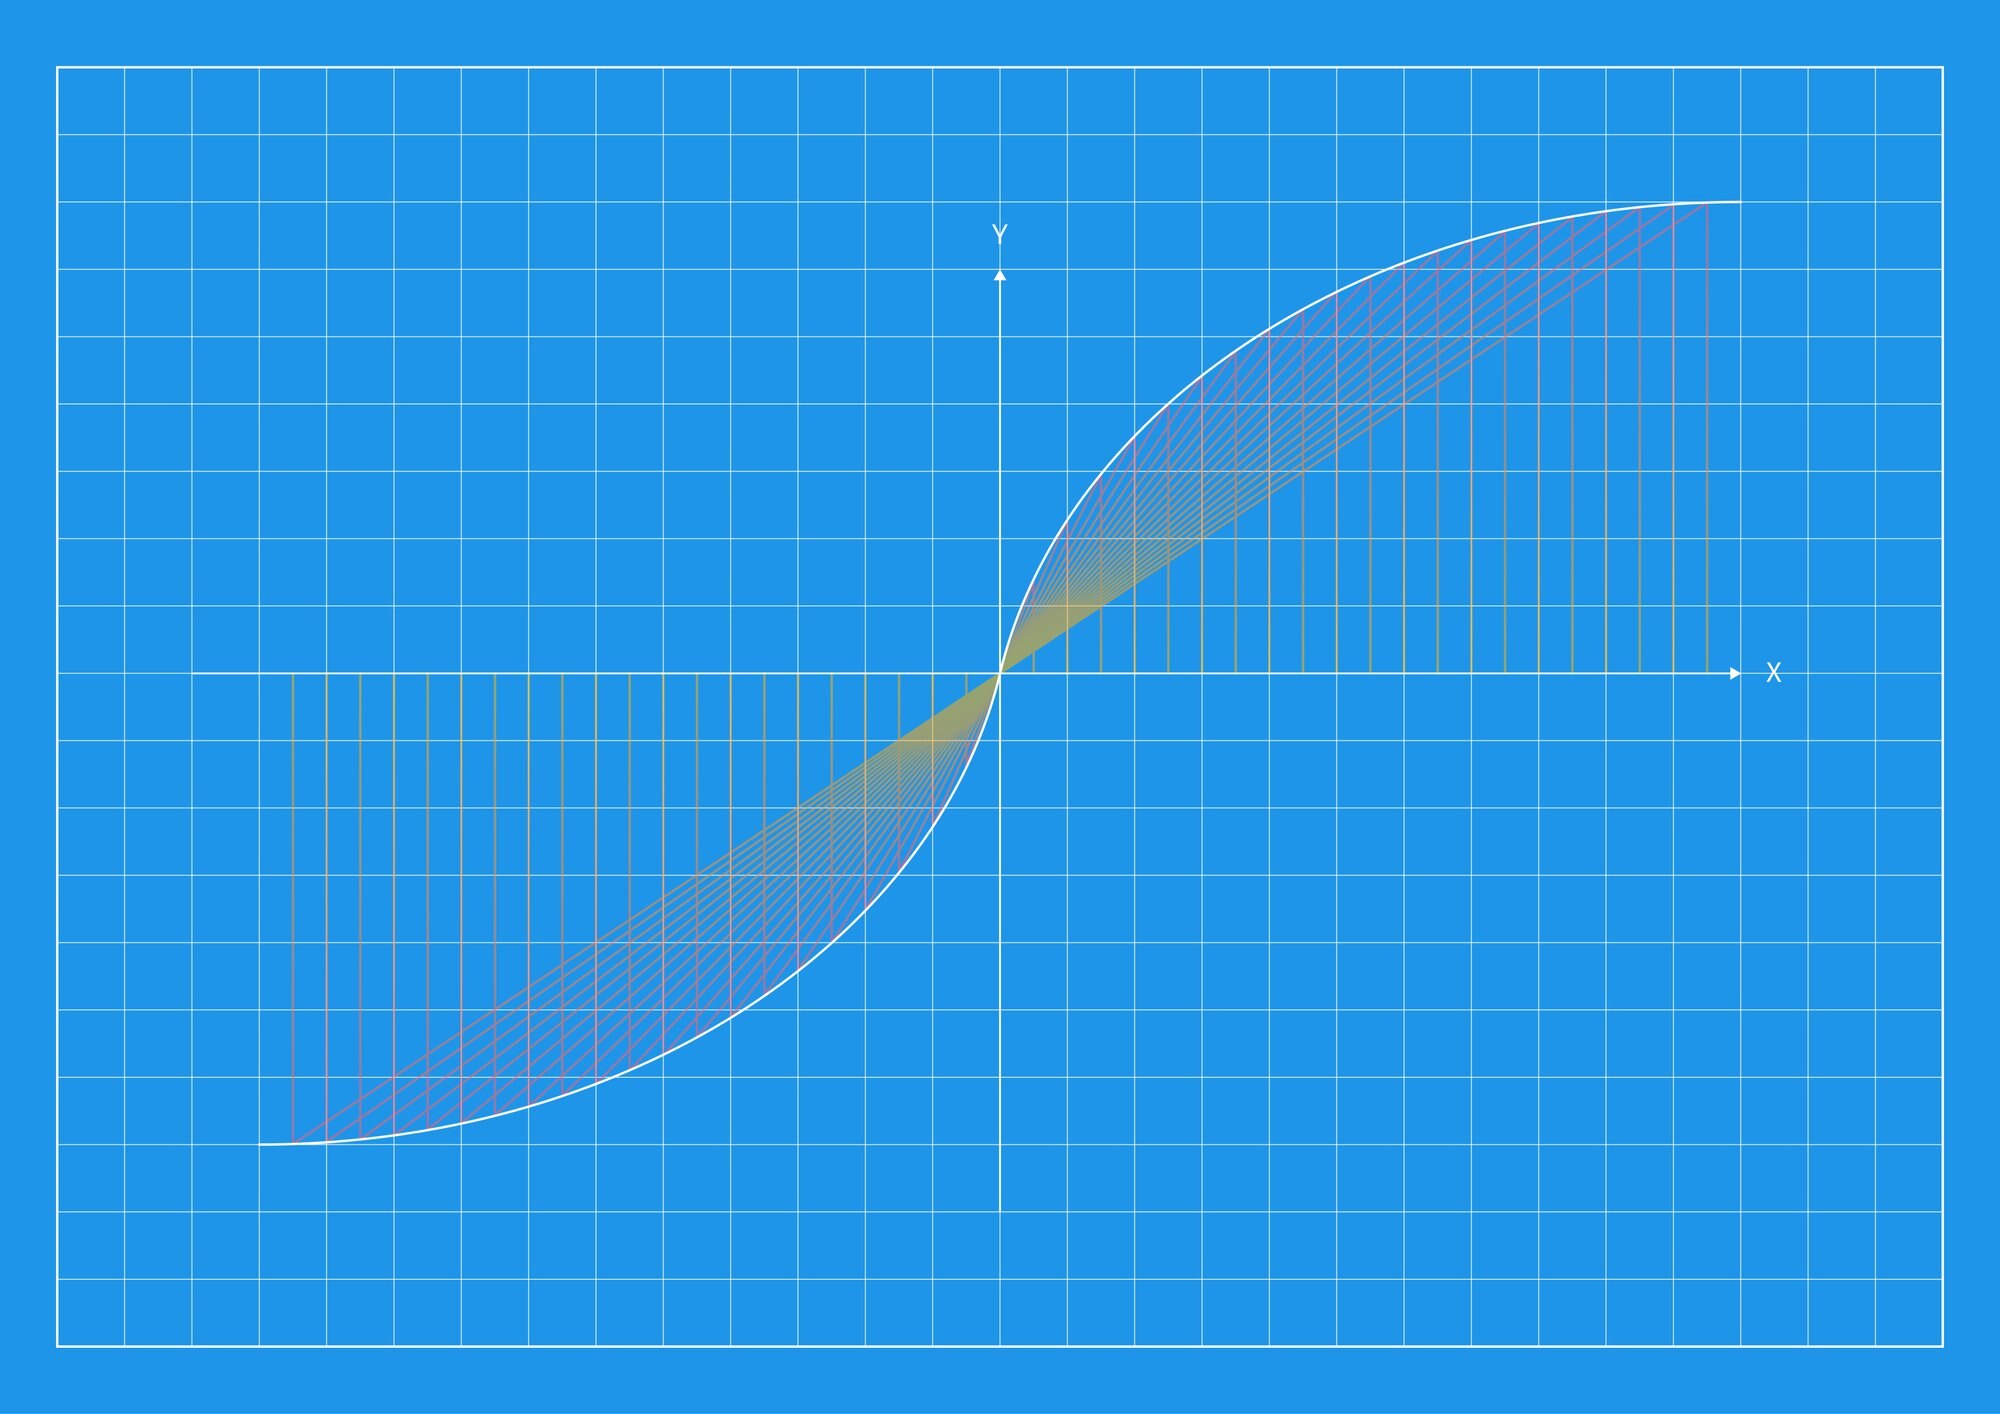

The domain and range of a graph are the inputs and outputs that actually occur: domain is the graph’s horizontal coverage, and range is its vertical coverage. Read each direction separately, counting a value whenever at least one included point supplies it. For each set, trace the coverage, settle the boundaries, then write the answer.
In This Article
- Read Each Axis Separately
- Write the Values in the Right Notation
- Decide Whether Each Endpoint Counts
- Keep Gaps and Separate Points Separate
- Look for Turning Points on Curves
- Separate Asymptotes From Window Edges
- Key Takeaways
- Frequently Asked Questions
- Check Both Sets Before You Finish
Read Each Axis Separately
Project every point straight down or up onto the x-axis. The positions covered form the domain of a graph. Project onto the y-axis for the range. A bend that changes the graph’s height may change its range without interrupting its horizontal coverage.
That difference makes tracing the curve from one endpoint to the other unreliable: the endpoints need not be its highest or lowest points. Sweep across the whole graph in each direction, including disconnected pieces.
The coverage also has to respect any stated context. If an input counts students in a classroom, negative numbers and fractional students are not allowed. A continuous line cannot override that restriction.
Write the Values in the Right Notation
Suppose a downward-sloping curve runs from a filled point to an open point, covering every height between them. Copying the domain’s brackets into the range would exclude the height it reaches and include the height it misses.
The smaller value goes first in either interval, regardless of the curve’s direction. A square bracket includes the boundary; a parenthesis excludes it. Use (x) for a domain condition and (y) for a range condition.
An unbounded interval has no final value to include. Infinity therefore always takes a parenthesis, and all real numbers are written ((−∞,∞)).
Decide Whether Each Endpoint Counts
A hole can leave the range unchanged. If a curve loses one point but reaches that same height elsewhere, the output survives. An open circle excludes a point, not every point along its horizontal level. For a function, however, removing its only point at an input removes that input from the domain.
The distinction is easier to see on a rising segment from an open circle at ((−3,2)) to a filled dot at ((4,6)). Here no other point supplies either endpoint’s coordinates. Its domain is ((−3,4]), and its range is ((2,6]). The open circle excludes both boundary values in this example because neither occurs elsewhere.
Keep Gaps and Separate Points Separate
Suppose a broken curve covers x-values from (−6) through (−2), then resumes at (1) and continues through (3), with all four boundaries included. Its domain is ([−6,−2]\cup[1,3]). Writing ([−6,3]) would silently draw in the missing inputs.
Those missing inputs do not settle the range. The separated pieces might cover the same heights. Combine intervals when their coverage leaves no gap; retain the union symbol when it does.
Endpoint and Gap Examples
| Graph example | Exact plotted set | Domain (x-values) | Range (y-values) | Endpoint or gap effect |
|---|---|---|---|---|
| Closed line segment | y = x + 1 for −2 ≤ x ≤ 3 | [−2, 3] | [−1, 4] | Both endpoints are included in both intervals. |
| Half-open line segment | y = 2x for 0 < x ≤ 3 | (0, 3] | (0, 6] | Open endpoint (0, 0) excludes x = 0 and y = 0. |
| Horizontal segment with open ends | y = 3 for −2 < x < 5 | (−2, 5) | {3} | Open endpoints exclude boundary x-values, but y = 3 is attained. |
| Two segments with a vertical gap | y = x for −3 ≤ x ≤ −1 or 1 ≤ x ≤ 3 | [−3, −1] ∪ [1, 3] | [−3, −1] ∪ [1, 3] | Neither x nor y takes any value strictly between −1 and 1. |
Isolated points need a different notation. For ((−4,1)), ((0,5)), and ((3,1)), the domain is ({−4,0,3}) and the range is ({1,5}). The repeated output appears once; nothing fills the space between the dots.
Look for Turning Points on Curves
A curve’s interior can supply the boundary that its endpoints fail to reveal. For the parabola (y=x^2), check both directions: it extends across every x-value, but no part falls below the vertex at ((0,0)). Its domain is ((−∞,∞)), and its range is ([0,∞)).
For the downward-opening parabola (y=−(x−1)^2+7), locate the highest included point, ((1,7)), rather than treating either visible end as a boundary. Both branches continue downward without a lower bound. Its range is ((−∞,7]): the parenthesis marks unbounded coverage, while the bracket includes the peak’s height.
Separate Asymptotes From Window Edges
In the Desmos Graphing Calculator, a branch can disappear through the top of the screen while still rising. Treating that crop as a maximum turns a display boundary into a mathematical claim. Zooming changes the display, not the function; use arrows, an equation, or stated continuation to interpret the missing portion. A cropped picture alone may leave the answer undetermined.
An equation can establish exclusions that a crop cannot. For (y=1/(x−2)), the denominator excludes (x=2), and the fraction cannot equal zero. Thus the domain is ((−∞,2)\cup(2,∞)), and the range is ((−∞,0)\cup(0,∞)). The branches approach the asymptotes (x=2) and (y=0) without reaching them. Other functions can cross horizontal asymptotes, so an asymptote label alone does not exclude an output.
Key Takeaways
- Treat finding domain and range as two separate coverage checks.
- Match each finite boundary’s bracket to an included point.
- Keep genuine gaps and isolated values visible in the notation.
- Use the whole curve to judge extremes and missing outputs.
Frequently Asked Questions
These questions apply the coverage test to formulas and common edge cases.
Is domain x or y?
Domain refers to x-values on the usual input-output graph. Axis labels matter: temperature plotted against time uses time as the input, even when it is labeled (t).
What are domain and range?
The domain and range of a function are its allowed inputs and actual outputs, respectively. Allowed inputs must satisfy any stated restrictions, including context such as counting whole students. If (f(x)=x+8) has domain ({0,2}), its range is ({8,10}), with no intervening outputs.
How do I find domain and range without a graph?
Use the formula and stated restrictions to identify allowed inputs, then determine which outputs they produce. Denominators cannot be zero, and real square roots require nonnegative radicands. For (y=\sqrt{x+4}), the domain is ([−4,∞)) and the range is ([0,∞)).
What is the domain of 2x + 1?
The domain of (f(x)=2x+1) is all real numbers unless a restriction is supplied. Multiplication and addition allow every real input here.
Does an open circle always remove that y-value from the range?
No; another included point can supply the same output. An open circle at ((1,4)) does not remove that height if a filled point at ((5,4)) remains.
Check Both Sets Before You Finish
Test one doubtful value in each answer. For a proposed domain value, look for an included point with that x-coordinate; for a range value, look for one with that y-coordinate. If you excluded the value because of a hole or a gap, check every other piece before ruling it out. One included point is enough to keep it.
Recommended for you
Math Line Plot: Each Mark a Measurement, Each Stack a Count
A line plot turns nine bean pod lengths into visible counts. Learn what marks and stacks mean, then build your own with fractions. See the worked example.

Stacked Bar Chart: Totals, Parts, and Shares Made Clear
A stacked bar chart shows totals and the parts behind them. Learn when to use counts or percentages, with a worked example and Excel steps. See the guide.
Pie Chart Examples: The Dollar Totals Behind Each Slice
Use pie chart examples with a $4,000 budget and $100,000 in sales to connect slices to dollars, calculate shares, and compare totals. See the calculations.

Behind an Absolute Value Graph: The Sharp Corner Explained
An absolute value graph has two rays and a sharp vertex. Learn how the equation sets its shape, range, and intercepts, then plot it correctly. See how here.
Bar Graph Scales: How Small Changes Look Much Bigger
A bar graph can make 35% to 39.6% look like a huge leap. Learn how scales and layouts shape comparisons, then build one from a small table. See the guide.
Velocity vs Time Graph: Slope, Area and Reversed Motion
Read a velocity vs time graph using a runner and a reversing cart. Connect slope to acceleration and signed area to displacement. See how motion adds up.
Cubic Graph Shapes: A Flat Point Isn’t Always a Turn
Learn why a cubic graph can flatten without turning, then use intercepts and transformations to sketch its shape and read solutions. See the worked sketch.
Right vs Left Skewed Histogram: What the Tail Reveals
A right vs left skewed histogram is named for its tail, not its tallest bars. Avoid reversed readings and check averages and binning. Explore the guide.