
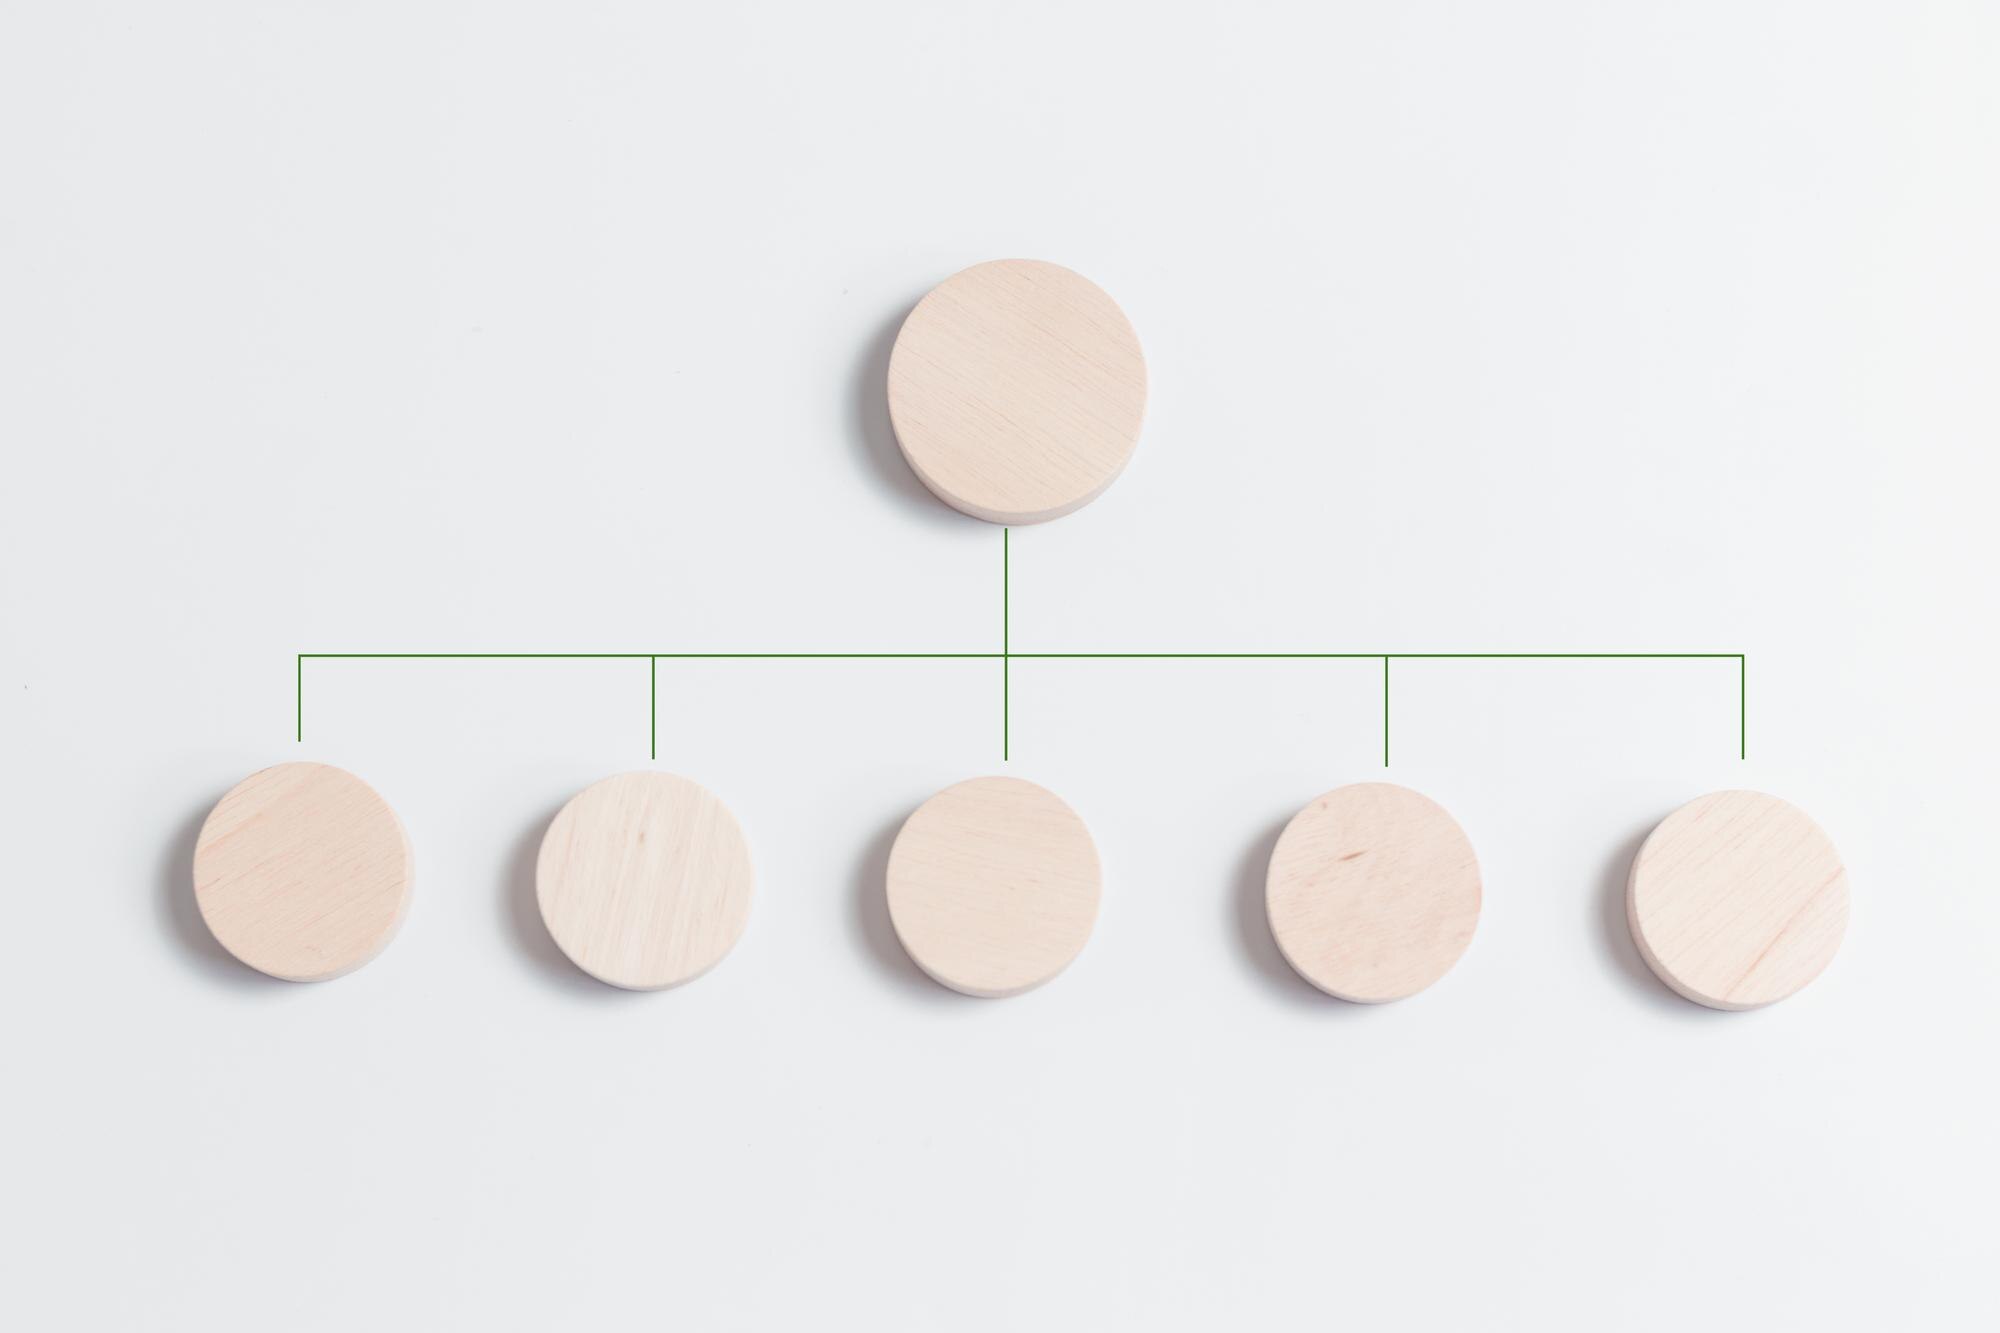

A tree diagram shows how one starting point branches into related parts or possible outcomes. In 1837, Charles Darwin sketched a branching evolutionary tree in a notebook, giving relationships among descendants a visible structure. The useful question is the same whether you are tracing ancestry or planning work: what connects to what?
In This Article
- Understand the Parts and Rules
- Build From a Clear Starting Point
- Read Each Level Before Following a Path
- Calculate Probabilities Along a Path
- Adjust for Events That Change the Next Draw
- Choose a Tool and Check the Structure
- Key Takeaways
- Frequently Asked Questions
- Start With One Clear Objective
Understand the Parts and Rules
Consider a tree for launching a newsletter:
Launch a newsletter
├── Prepare content
└── Set up delivery
“Launch a newsletter” is the root. The two labels beneath it are its children, and it is their parent. For now, both children are leaves: neither has children of its own. Add tasks beneath “Prepare content,” and that node remains a child of the root while becoming a parent itself.
Those connections define a tree structure diagram. Every non-root node has exactly one parent, and exactly one path connects it to the root. There are no cycles. If the two newsletter branches merge into one shared node, or an extra connector links a node to one of its ancestors and creates a cycle, the drawing becomes another kind of graph. A flowchart can accommodate those connections; a tree cannot.
Build From a Clear Starting Point
To create a tree diagram, give the root one job: state the objective, category, or starting condition. For the newsletter, let every connection mean “requires this work.” Under “Prepare content,” add “Draft articles” and “Edit copy.” Under “Set up delivery,” add “Choose a platform” and “Configure signup.”
Launch a newsletter
├── Prepare content
│   ├── Draft articles
│   └── Edit copy
└── Set up delivery
    ├── Choose a platform
    └── Configure signup
The resulting levels move from a broad objective to finer detail. Keep siblings comparable: each should answer the same question about its parent. “Draft articles” and “Edit copy” both name tasks. “Draft articles” and “Marketing department” do not. One tells you what to do; the other tells you where people work.
Read Each Level Before Following a Path
Read across the newsletter’s first level before descending into its tasks. That reveals two work areas; following only the content branch could leave delivery out of your understanding entirely. In an organizational hierarchy tree, the same reading method separates departments from the teams beneath them.
Then trace a complete path and put its connectors into words: launching the newsletter requires preparing content; preparing content requires drafting articles. Depth counts the steps from the root, so this task sits two connections away.
The verbal test matters more than the boxes. “Reports to,” “is part of,” and “happens next” make different claims. Read every edge as a sentence using the diagram’s chosen relationship.
Calculate Probabilities Along a Path
Suppose someone offers you a bet: you win if two independent fair coin tosses produce exactly one head. Is that a more likely result than getting matching faces? A tree makes the comparison explicit.
From the starting node, draw heads, H, and tails, T. Label both branches 1/2, or 50 percent. From each outcome, draw another H and T pair, again labeled 1/2. The completed paths are HH, HT, TH, and TT:
Two independent fair coin tosses
├── H (1/2)
│   ├── H (1/2) → HH: 1/4
│   └── T (1/2) → HT: 1/4
└── T (1/2)
    ├── H (1/2) → TH: 1/4
    └── T (1/2) → TT: 1/4
Multiply along each path: HH = (1/2) × (1/2) = 1/4. The same calculation gives HT = 1/4, TH = 1/4, and TT = 1/4.
Your winning paths are HT and TH. They are disjoint: a single sequence cannot be both. Adding them gives P(exactly one head) = 1/4 + 1/4 = 1/2. The matching-face paths make up the other half. The offer gives neither result a probability advantage; whether the bet is worthwhile also depends on the payout.
The working rule is multiply along a path; add disjoint paths.
Adjust for Events That Change the Next Draw
Now replace the coins with a bag containing 3 red balls and 2 blue balls. Draw twice without replacement. The first red branch is 3/5, but copying that label onto the next red branch would be wrong: only 2 red balls remain among 4 balls.
The complete tree labels each branch with its probability given the preceding draw:
3 red, 2 blue; without replacement
├── Red (3/5)
│   ├── Red (2/4) → RR
│   └── Blue (2/4) → RB
└── Blue (2/5)
    ├── Red (3/4) → BR
    └── Blue (1/4) → BB
So P(two reds) = (3/5) × (2/4) = 3/10.
A first blue draw creates a different situation: the next red probability is 3/4. Each parent represents its own remaining bag. Label the branches from that situation, not from memory of the root.
With replacement, the first ball goes back and restores the original composition. Now P(two reds) = (3/5) × (3/5) = 9/25. Write “with replacement” or “without replacement” beside the root. That small label changes the answer.
Choose a Tool and Check the Structure
Choose paper for a small tree you can keep legible; use a drawing tool when revisions make the connectors hard to follow. The choice matters less than whether a reader can distinguish every parent-child connection.
Crowded sibling groups can make a connector appear to join the wrong box. Crossed lines can hide an accidental extra parent. Long labels can obscure where one node ends and another begins. Separate the groups, shorten labels without losing their meaning, and trace every leaf back to the root.
Color creates another failure mode if it carries information that the labels omit. Give branches readable text and consistent connectors so their meaning survives without color. A missing leaf is harder to spot than a crooked line: compare the finished branches against the items you intended to include.
Key Takeaways
- Give the root a scope narrow enough that you can recognize an unrelated branch.
- Use the newsletter’s task levels as a test: can siblings answer the same question?
- For probability trees, distinguish a complete outcome from an event containing several outcomes.
- Treat a changed assumption as a reason to revisit downstream labels, even when the drawing itself stays unchanged.
Frequently Asked Questions
What Is a Tree Diagram Used For?
Tree diagrams show branching relationships, such as folders within folders or successive possible results. Use one when the route from a common starting point matters to the explanation.
How Do I Prepare a Tree Diagram?
Write the question the finished diagram must answer, then gather and group the relevant items. Consider the reader: a work plan for an editor may need different leaves from one for the person configuring delivery.
How Do I Make a Tree Diagram Without Drawing Software?
Write the root on paper and connect it to boxed child labels, or use an indented text outline. In the text version, put each child on its own line and increase indentation for every deeper level.
Must the Probabilities Leaving Each Parent Add Up to 100 Percent?
Yes, if those branches cover all possible, mutually exclusive next outcomes. A different total points to a missing outcome, overlapping choices, or an incorrect label; it does not tell you which error occurred.
When Should I Stop Adding Branches?
Stop when every leaf supplies enough detail to answer the original question. In a work plan, that can be an action someone can own; in a probability experiment, it is a complete outcome.
Start With One Clear Objective
Check your understanding: a colleague connects both “Prepare content” and “Set up delivery” to a single shared “Choose a platform” node. Is the result still a tree?
No: the shared node now has two parents. Keep the task beneath the work area it belongs to. If the diagram must show shared dependencies, use a graph that permits multiple parents rather than forcing those relationships into a tree.
Recommended for you

Right vs Left Skewed Histogram: What the Tail Reveals
A right vs left skewed histogram is named for its tail, not its tallest bars. Avoid reversed readings and check averages and binning. Explore the guide.

Basics: What Is a Heat Map? Why the Legend Matters
What is a heat map? Learn how colors represent values, why sales dollars can be mistaken for orders, and how to read axes and legends. See the examples.

The Future of Reading: How AI Changes Book Discovery and Enjoyment
Libraries logged hundreds of millions of digital book checkouts last year, while neural text-to-speech can now produce a clean, hour-long audiobook in minutes. Meanwhile, recommendation models trained on billions of reading interactions quietly shape what appears in your “Because you liked…” rows. The future of reading is no longer just about pages and covers; it’s […]
Symmetric Histogram: Balance Beyond the Tallest Bar
A symmetric histogram mirrors bars around a center, not always its tallest peak. Compare tails and see how bin boundaries affect balance. Read the example.

Inside a Violin Plot: Same Median, Different Shapes
A violin plot can reveal different bill patterns behind the same median. Learn how shape, points, and smoothing affect comparisons. See the restaurant example.

Histogram Patterns: What Clinic Waiting Times Reveal
A histogram turns clinic waiting times into visible clusters and gaps. Learn what bins and bar heights mean, and how to choose bin widths. See the example.

Deep Reading in a Digital World: Stay Focused in an Age of Distraction
Your attention is outnumbered: surveys put daily phone pickups in the 50–150 range and notifications in the dozens, while a single interruption can cost several minutes to regain depth. If you want Deep Reading in a Digital World: How to Stay Focused in the Age of Distraction, you need a deliberate method, not willpower. This […]
Exponential Graph: Fixed Multipliers, Curved Results
An exponential graph multiplies outputs at equal input steps. Use points and the y=0 asymptote to sketch growth and decay curves. See the plotting steps.