
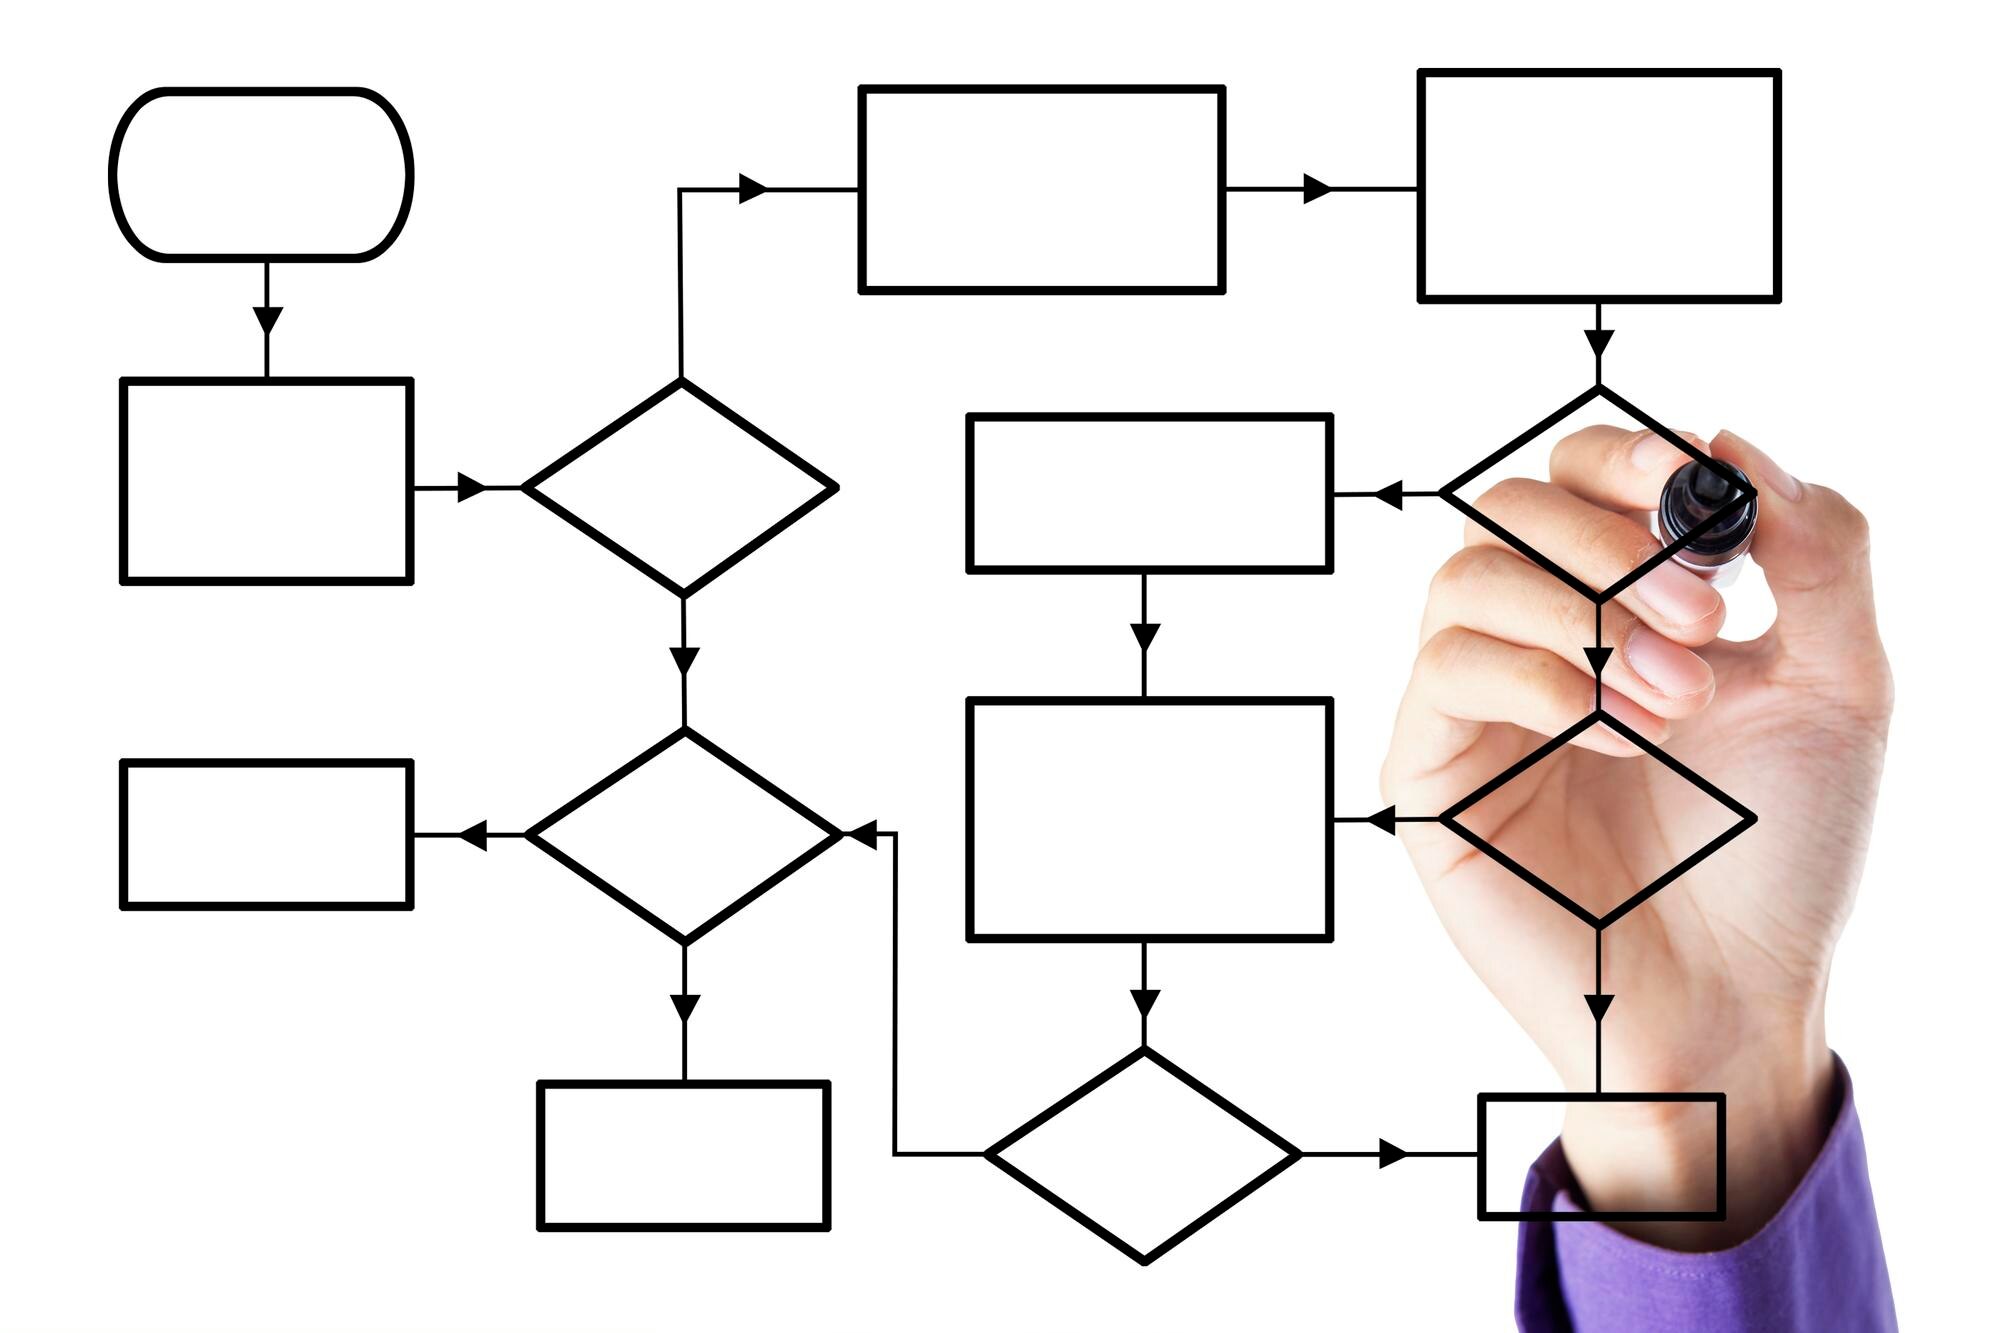

Flowchart symbols identify what each step does: an action, a decision, information handling, or a connection to another part of the process. Arrows show how those steps fit together. Learning the shapes lets you read a diagram without guessing what its boxes mean.
This reference explains common flowchart symbols, their meanings and practical uses. Each group describes what the shapes represent and where they belong in a workflow.
In This Article
- Recognize the Basic Shapes
- Follow Arrows and Decision Routes
- Separate Information From Stored Records
- Connect Distant Parts Without Long Lines
- Recognize Specialized Work Steps
- Use a Consistent Notation
- Key Takeaways
- Frequently Asked Questions
- Choose Shapes That Clarify Each Step
Recognize the Basic Shapes
The most useful flowchart diagram symbols are the start/end marker, rectangle, and diamond. A start/end marker, also called a terminator, is usually an oval or rounded rectangle. It marks the boundary of the process you are explaining, not necessarily the beginning or end of every related activity.
  ___________       ┌─────────────┐             /\
 /           \      │             │            /  \
(  Start/End  )     │   Action    │           /Decision\
 \___________/      │             │           \        /
The rectangle is the process symbol: it represents work performed at that point. Give it an action label, such as “Inspect returned equipment.” The diamond asks a question whose answer determines the next route, such as “Damage found?” Keeping actions and questions separate makes the diagram easier to interpret.
Follow Arrows and Decision Routes
An arrow, or flowline, connects steps and shows direction. Arrange the main route consistently, commonly from top to bottom or left to right. A line without an arrowhead can leave readers uncertain about which step comes next.
For the equipment inspection, the decision could send “Yes” to a repair assessment and “No” to cleaning. Put those labels beside the diamond’s outgoing arrows. A route that returns to an earlier step represents repetition; give that return enough space to distinguish it from the main path. Line crossings should not look like junctions unless the routes actually join.
Separate Information From Stored Records
Information-related flow diagram symbols distinguish receiving data, producing a document, and accessing stored records. These activities may occur next to one another, but they describe different work.
    ______________       ┌──────────────┐          .──────────.
   /             /       │              │        (            )
  / Input/Output/        │   Document   │        │────────────│
 /_____________/         │              │        │  Database  │
                         └───╮    ╭─────┘        │            │
                             ╰────╯              (____________)
The parallelogram represents input or output, such as receiving an inspection reading. The document symbol in flowchart notation has a wavy bottom and represents a document, whether printed or electronic; an inspection certificate is one example. The cylinder represents a database, such as an equipment maintenance database. The stored-data symbol has straight top and bottom edges, an outward-curving left side and an inward-curving right side. It indicates where data is stored within a process. Use it for a storage location without specifying a database, for example, “Stored inspection readings.” Use the cylinder when identifying a database. Neither symbol specifies manual entry.
Compare eight common shapes below. Arrows, connectors and additional specialized symbols are explained in the surrounding sections.
Eight common flowchart shapes: meanings, examples and selection trade-offs
| Flowchart symbol (shape) | Meaning | Best-use example | Benefit | Limitation or trade-off |
|---|---|---|---|---|
| Terminator (oval or rounded rectangle) | Start or end of a process | “Inspection begins” or “Equipment released” | Makes process boundaries explicit | Does not describe a task; use a rectangle for work steps |
| Process (rectangle) | An action or task | “Inspect safety guard” | Keeps routine steps simple and readable | Does not show branching; use a diamond for a condition |
| Decision (diamond) | A condition that selects a path | “Guard secure?” with Yes and No exits | Makes alternative routes explicit | Needs labelled exits so readers can follow each outcome |
| Input/output (parallelogram) | Data entering or leaving a process | “Receive sensor reading” | Distinguishes data transfer from task execution | Does not identify a document, database or manual-entry method |
| Document (rectangle with wavy bottom) | A document used or produced | “Issue inspection certificate” | Highlights a specific record or deliverable | Adds detail that is unnecessary when the document itself is unimportant |
| Database (cylinder) | Data held in a database | “Equipment maintenance database” | Distinguishes a database from data movement | Does not show a read, write or manual-entry action by itself |
| Predefined process (rectangle with double vertical sides) | A named subprocess defined elsewhere | “Run calibration procedure” | Keeps reusable multi-step routines compact | Readers need the separate procedure to see its internal steps |
| Manual input (quadrilateral with sloping top) | Data entered by a person | “Technician enters serial number” | Distinguishes human entry from automated input | Adds notation detail; a parallelogram is simpler if entry method is irrelevant |
Connect Distant Parts Without Long Lines
Connectors continue a route without drawing an arrow across the entire diagram. An on-page connector is a small circle. An off-page connector is a pentagon shaped like a home plate, with its point facing downward.
      .─────.                  ┌─────────┐
     /       \                 │         │
    (    A    )                │    B    │
     \       /                  \       /
      '─────'                    \     /
    On-page                    Off-page
Matching labels make these symbols useful. For example, two circles labeled “A” connect separated parts of the same page. An off-page marker labeled “B: Repair Assessment” should correspond to a clearly labeled continuation on the destination page. A connector is a routing aid, not an activity, so avoid labels that sound like instructions to perform work.
Recognize Specialized Work Steps
Some tasks need more precise notation than a rectangle provides. These additional process flow symbols describe how work happens or why the route pauses.
          _______          ______________          __________
      ___/      │          \            /         /          \
  ___/          │           \          /         / Preparation\
 │ Manual Input │            \ Manual /          \            /
 └──────────────┘             \______/
                                                  \__________/
                           Manual Operation

 ┌──────────.                    __________
 │           \                  /          \
 │   Delay    )                <  Display   )
 │           /                  \__________/
 └──────────'
Manual input uses a quadrilateral with a sloped top. It means a person enters information, such as typing an equipment serial number. Manual operation uses a trapezoid, typically wider at the top, for work performed by hand, such as tightening a fitting.
Preparation uses a hexagon for setup or initialization, such as setting an inspection counter to zero. Delay uses a D-shaped outline for a waiting period, such as allowing a coating to dry. Display uses a screen-shaped outline for information presented on a screen, such as showing a test result to an operator. Add these distinctions when they affect how someone understands or performs the process.
Use a Consistent Notation
Consistency matters more than using every shape in a software library. FIPS Publication 24 covers flowchart symbols used in information processing. NIST lists it as withdrawn on August 23, 1988, so treat it as a historical reference, not a current standard. Modern tools may offer different notation.
That distinction also matters across disciplines. In engineering, process flow diagram symbols may represent equipment such as pumps or heat exchangers, not the workflow steps described here. If your audience might confuse those systems, identify the diagram type. For unfamiliar or customized shapes, include a small legend and use each shape with one meaning throughout.
Key Takeaways
- Shapes describe the kind of step; arrows show its place in the sequence.
- Use a rectangle for an action and a diamond for a decision.
- Input/output and document shapes describe different kinds of information handling.
- Label decision exits and connectors so readers can follow each route.
- Start with familiar shapes and add specialized notation only when needed.
Frequently Asked Questions
What Are the Four Main Types of Flowcharts?
One common grouping includes process flowcharts, workflow diagrams, swimlane flowcharts, and data flow diagrams. These emphasize steps, work movement, responsibility, and data movement, respectively. There is no single universal four-type classification.
Does Every Decision Diamond Need Exactly Two Exits?
No. A decision can have more than two exits when it selects among several distinct outcomes. Label every exit, and make the conditions clear enough that readers know which route applies.
When Should an Off-Page Connector Replace a Long Arrow?
Use an off-page connector when the route continues onto another page. A long route that stays on the same page can use an on-page connector instead. Include a destination reference when the continuation would otherwise be hard to locate.
Can a Flowchart Have More Than One End Symbol?
Yes. Separate endpoints can represent different outcomes, such as “Equipment released” and “Equipment retired.” Name each outcome so the reader understands why that route stops.
Are Flowchart Shapes Standardized Across Every Diagramming Tool?
No. Tools share many conventional shapes, but their names, libraries, and defaults can differ. A template for a specialized notation may also assign meanings that do not belong to a general-purpose flowchart.
Choose Shapes That Clarify Each Step
Write the steps of one process in plain language before choosing shapes. In the equipment example, distinguish recording an inspection result from producing a certificate: the diagram should make clear what information is recorded and what document is produced.
Test the draft by tracing one ordinary outcome, an exception and any returning route. Read each label and follow its outgoing arrow: would another person know what happens next? Revise any ambiguous step or connection.
Recommended for you

Stacked Bar Chart: Totals, Parts, and Shares Made Clear
A stacked bar chart shows totals and the parts behind them. Learn when to use counts or percentages, with a worked example and Excel steps. See the guide.

Money Market Graph: The Cash Squeeze Behind Rate Rises
A money market graph links cash needs to interest rates. Learn how to read its axes, find equilibrium and track supply or demand shifts. See the breakdown.
Exponential Graph: Fixed Multipliers, Curved Results
An exponential graph multiplies outputs at equal input steps. Use points and the y=0 asymptote to sketch growth and decay curves. See the plotting steps.
Pie Chart Examples: The Dollar Totals Behind Each Slice
Use pie chart examples with a $4,000 budget and $100,000 in sales to connect slices to dollars, calculate shares, and compare totals. See the calculations.

Histogram Patterns: What Clinic Waiting Times Reveal
A histogram turns clinic waiting times into visible clusters and gaps. Learn what bins and bar heights mean, and how to choose bin widths. See the example.

Bode Plot Gain and Phase: Where Feedback Can Go Wrong
Read a bode plot's gain and phase together to avoid misleading stability judgments. Learn where to measure gain and phase margins; see the worked example.

Line Graph Scales: Why the Same Data Can Look Different
A line graph can exaggerate a modest change. Learn to check axes, read a five-month sales example and build clearer charts from your data. Explore the article.
Picture Graph Keys: When Four Stars Mean Twenty Books
Read a picture graph without mistaking symbols for counts. See how four stars represent 20 books, use the key, and compare categories in the worked examples.