
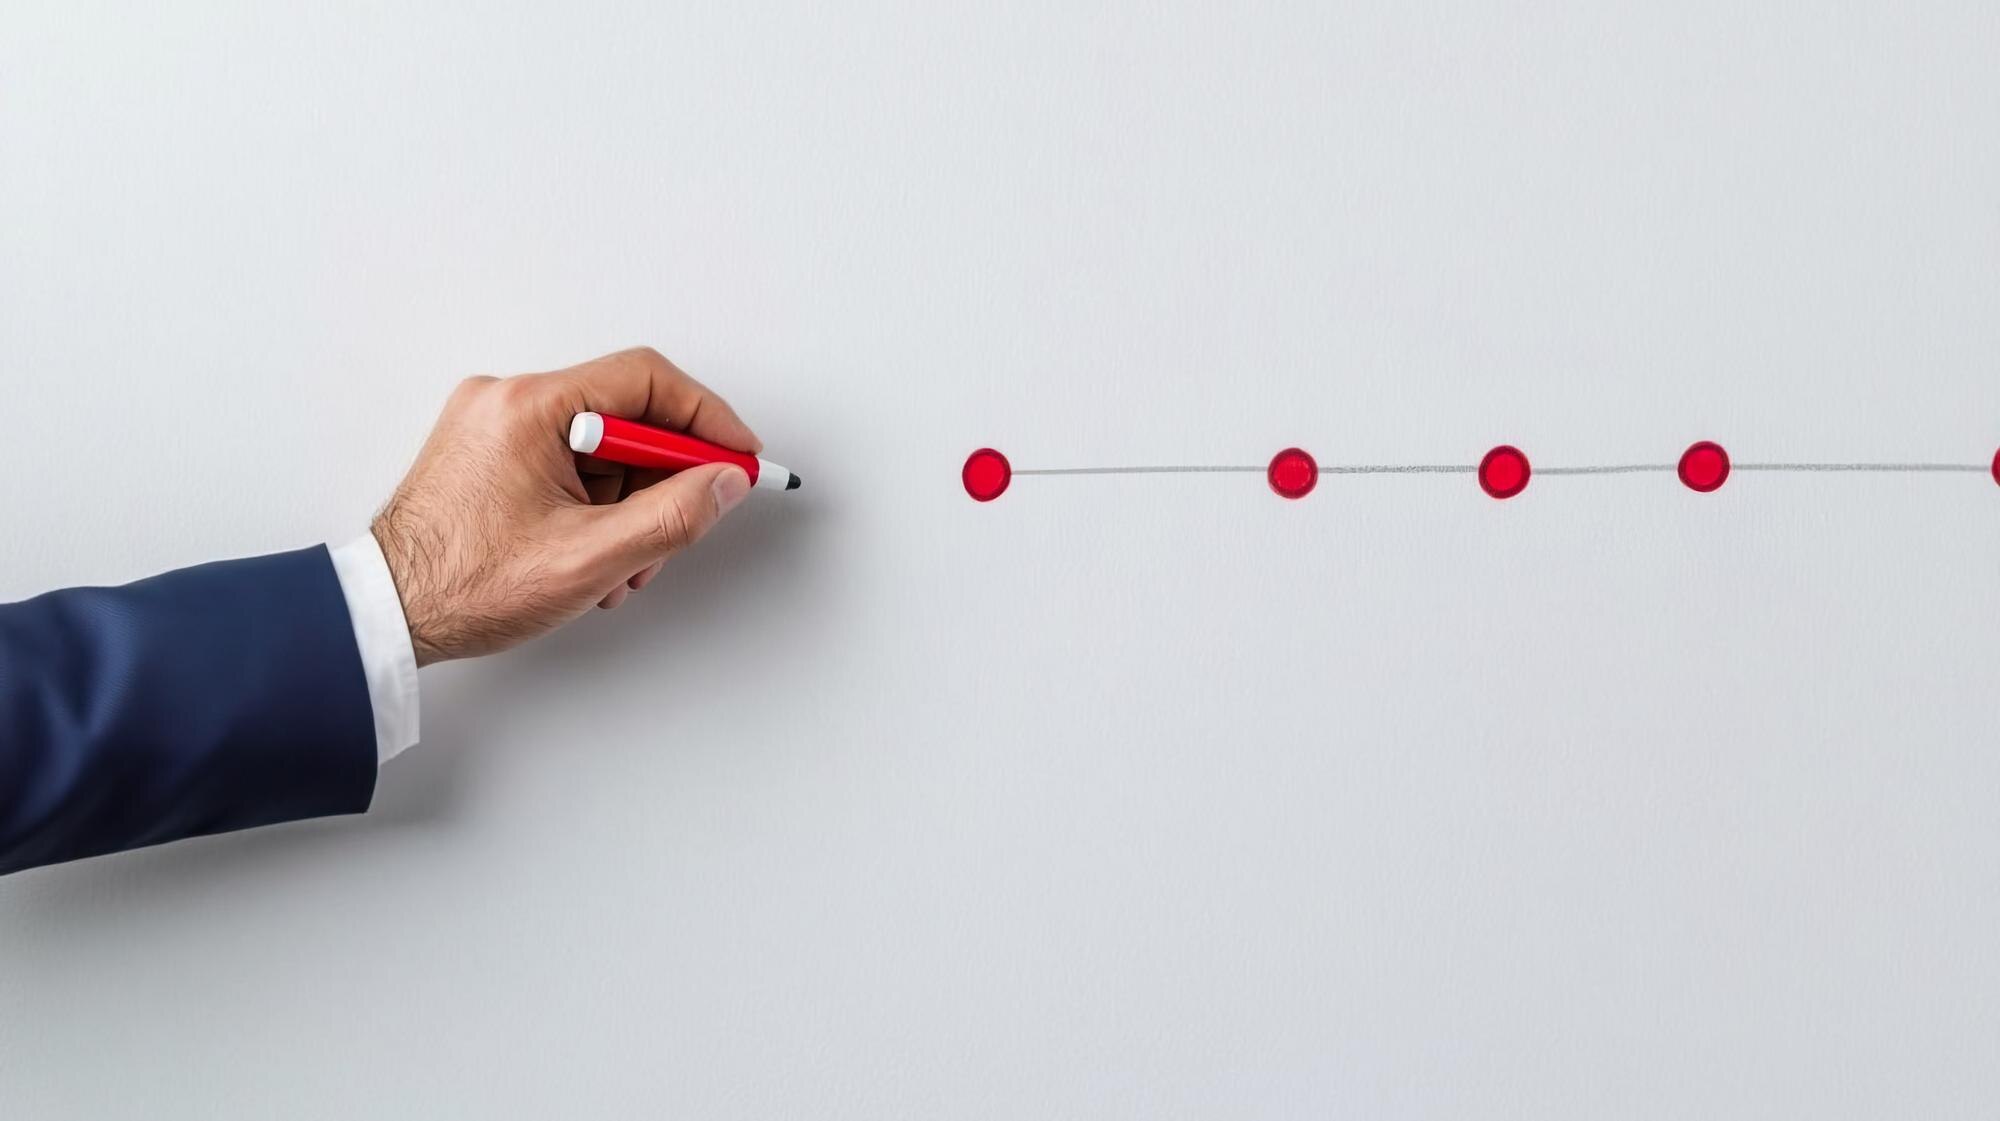

What is a timeline? A timeline is a visual representation of events in time order, using dates or periods to show when things happen and, where needed, how long they last. That difference matters: a launch date marks a moment, while the conditions leading up to launch develop over time.
For a simple school-project timeline, use three labeled milestones: topic chosen on September 3, draft completed on September 10, and presentation delivered on September 17. These dates are hypothetical. Each milestone marks a moment; the research and writing between them take time. A reader should be able to distinguish those points from duration bars before comparing gaps or overlaps. Choose the entries and time scale to make that distinction clear.
In This Article
- What a Timeline Shows
- Choose a Time Scale That Fits
- Common Timeline Formats
- Clear Examples for School and Work
- When to Use a Gantt Chart or Flowchart
- How to Build a Readable Timeline
- Key Takeaways
- Frequently Asked Questions
- Start With the Events That Matter
What a Timeline Shows
A timeline connects each entry to a moment or a stretch of time. A graduation ceremony gets a point; the months spent completing a degree get a bar. That distinction lets you see whether activities overlap or whether a long pause separates them.
Chronology alone does not prove causation: an earlier event is not necessarily the cause of a later one. Ask what evidence connects the entries beyond their order. For plans, also distinguish a deadline from the work that must happen before it.
Choose a Time Scale That Fits
Match the scale to the question. Minutes can explain a sporting event; decades can explain a university’s development. Someone studying one department probably needs a narrower period than the institution’s entire history.
Consider a deliberately bad layout: a university history covering 1950–2000, with a tick for every hour. Even one year becomes a mass of marks. The founding of a department and its later expansion disappear among divisions that tell the reader nothing useful. Decade marks would give those events room; an inset could handle a pivotal week.
For a 1-year plan, monthly divisions may be enough. A short event schedule may need hours. Choose units that reveal the difference you want readers to compare.
Those units also govern spacing. Equal distances on a scaled timeline mean equal elapsed time. If you space entries evenly for readable labels instead, mark the timeline “not to scale.” Show substantial breaks explicitly so a long quiet period does not look like a brief interval.
Common Timeline Formats
A horizontal timeline suits a slide or wide display, with entries running left to right. Its weakness becomes obvious when twelve long labels compete for one line: at 12-point type, the audience leans forward, loses its place between labels, and misses the event being discussed. Shorten the labels or change the layout.
A vertical timeline gives longer entries room down the page. It suits documents and narrow screens, where readers can move from one explanation to the next without scanning sideways. Put earlier events at the top for a developing story; put the newest first when recent updates matter most.
An interactive timeline lets readers select an entry for photographs or source notes. Keep the event and date visible before that selection, so the basic account remains understandable. Choose interaction when the extra material earns the reader’s effort, not as a remedy for an overcrowded design.
Clear Examples for School and Work
Each timeline example below pairs a purpose with the entries that serve it. The spaceflight and aircraft dates are factual; the office schedule is hypothetical.
For a classroom account of Apollo 11, NASA’s mission records support this sequence: July 16, 1969: launch; July 20, 1969: lunar landing; July 24, 1969: splashdown on Earth. These entries give the mission a beginning, a central milestone, and an end. On a timeline using calendar dates only, the two four-day intervals take equal space; NASA’s recorded times of day make the exact elapsed intervals unequal. A study of the landing itself needs a tighter window and more detail about that part of the mission.
A documented product timeline example is Boeing’s 787: rollout on July 8, 2007, and first flight on December 15, 2009. A scaled axis makes the wait between a public rollout and first flight impossible to miss. These milestones describe development progress, not a complete production schedule.
A workplace timeline chart example might cover an office renovation. Furniture selection runs from January through February, while electrical work also takes place in February. Painting follows in March; staff move in during April.
Collapse that schedule onto one line and the labels can imply that furniture selection finishes before electrical work starts. Separate rows expose the overlap. Staff can then see that two activities occupy February, while detailed work instructions remain in a separate plan.
When to Use a Gantt Chart or Flowchart
The renovation’s overlap becomes a scheduling problem if one task depends on another. Cabinet installation, for example, may require completed wall repairs. A Gantt chart is a specialized project timeline with task-duration bars. Add dependency links to connect those tasks explicitly instead of leaving readers to infer a constraint from nearby bars.
A flowchart handles a different problem: whether an action should proceed at all. The Rogers Commission’s 1986 report on Challenger described failures in communication and decision-making before launch. A launch chronology can record when concerns were raised; a decision diagram would need to show how a safety concern changes the path to approval. That is branching logic, not elapsed time.
The same distinction applies to a laboratory sample: acceptance criteria determine whether it proceeds or is rejected. Use the comparison below to choose the relationship your visual must explain.
Simple timeline, Gantt chart, or flowchart: choose the right visual
| Visual | What it shows | Key distinction |
|---|---|---|
| Simple timeline | Dated events or project milestones | Shows sequence and timing, but dates alone do not explain dependencies or decisions |
| Gantt chart | Tasks plotted as duration bars | Shows work periods and overlaps; dependency links, when included, identify scheduling constraints |
| Flowchart | Steps and conditional branches | Shows which path to follow, rather than inherently showing calendar dates or elapsed time |
How to Build a Readable Timeline
Make a working list before designing anything. Record each candidate entry’s date or range alongside a short description. Keep sources with real events, and distinguish documented dates from estimates while the evidence is still at hand.
Then cut entries that do not advance the explanation. For a hypothetical school newspaper’s journey to its first issue, reject “Weekly editorial meeting”: it records attendance, not progress. Cut “Reminder email sent” too, unless that message resolved a delay that matters to the story. Keep the editorial meeting that selected the team if that decision enabled publication.
Give the surviving entries parallel labels: “Editorial team selected” and “First issue published.” Replace an ambiguous “Review” with “Faculty review completed.” The wording should tell readers what changed without requiring your planning notes.
Only then build the layout. Give events and periods distinct, consistent marks, with a legend where needed. Explain important differences in text instead of relying on color alone. Label a shared plan “planned,” “actual,” or “revised,” and include an updated date so readers know which version they have.
Then test the draft on someone who did not help make it. Ask what happened and where they see a delay or overlap. Their answer reveals whether your selection works before you spend time polishing it.
Key Takeaways
- Select entries by the question they answer, not by how many dates you have collected.
- Give milestones and stretches of activity visibly different treatment.
- Match the time scale to the comparison readers need to make.
- Keep overlapping activities visible; use explicit connections for dependencies.
Frequently Asked Questions
What is the purpose of a timeline?
A timeline makes the order and timing of events easy to understand. A museum exhibit, for example, can place an artifact beside events from its period to explain its context.
What does “What is your timeline?” mean?
It means “When do you expect this to happen or be finished?” For a report, answer with the expected delivery date and any intermediate deadline that affects the person asking. A diagram is optional.
What is a timeline on social media?
A social media timeline is the feed of posts or updates you view. Depending on the platform and selected view, posts may follow publication time or a ranking system. “Timeline” therefore does not promise chronological order.
What is a timeline for a person?
A personal timeline records selected events in someone’s life. For a biography or school assignment, include changes such as moving cities or beginning a job when they help explain the person’s story. For private reflection, you can include sensitive details that should stay out of a public version.
What are common timeline formats?
Common formats include horizontal, vertical, and interactive timelines. These describe presentation, so an interactive version can also run horizontally or vertically. Historical and project timelines instead describe what the timeline covers.
How far back or forward should a timeline go?
Begin where readers need context and end where your explanation or planning responsibility stops. A book-publication timeline might begin with manuscript submission; a timeline about writing that book would start earlier. Extra years earn their place only if they explain an entry that matters.
Start With the Events That Matter
The school-project milestones show when key moments occur; Apollo 11’s dates outline a mission; the renovation schedule shows activities sharing the same month. Each answers a different question through its choice of entries and treatment of time.
It can show sequence, duration, gaps, and overlaps.
Recommended for you
Sin Graph From the Unit Circle: Five Points, One Wave
Build a sin graph from unit-circle heights and five key points. Learn amplitude, period, and shifts, then read equations from curves. See the steps inside.
Right vs Left Skewed Histogram: What the Tail Reveals
A right vs left skewed histogram is named for its tail, not its tallest bars. Avoid reversed readings and check averages and binning. Explore the guide.
Box Plot Reading: A Shorter Box Doesn’t Mean Faster
A box plot shows center and spread, not speed alone. Use task-time examples to compare medians and variability on the same scale. See the worked example.

What Is a Diagram? Explanation, Not Just Illustration
What is a diagram? Learn how labeled shapes and connecting lines explain relationships, how diagrams differ from drawings, and how to read one. Read on.
Domain and Range of a Graph: Which Endpoints Count?
Read the domain and range of a graph by checking each axis, endpoints, gaps, and turning points. Get the notation right—see the step-by-step explanation.
Circular Flow Diagram: A $4 Loaf Links Two Markets
A circular flow diagram connects a $4 bread purchase to work and income. Learn how goods and money move through two markets. Follow the example in the article.
Decoding Flowchart Symbols: What Each Shape Tells You
Flowchart symbols distinguish actions, decisions, and connections. Learn where rectangles, diamonds, and arrows belong to read workflows clearly. See the guide.
Volcano Plot: Tallest Dots Aren’t Always the Best Hits
A volcano plot pairs fold change with statistical evidence. Learn why the tallest dots can mean small effects and how to assess candidates. See the guide.