
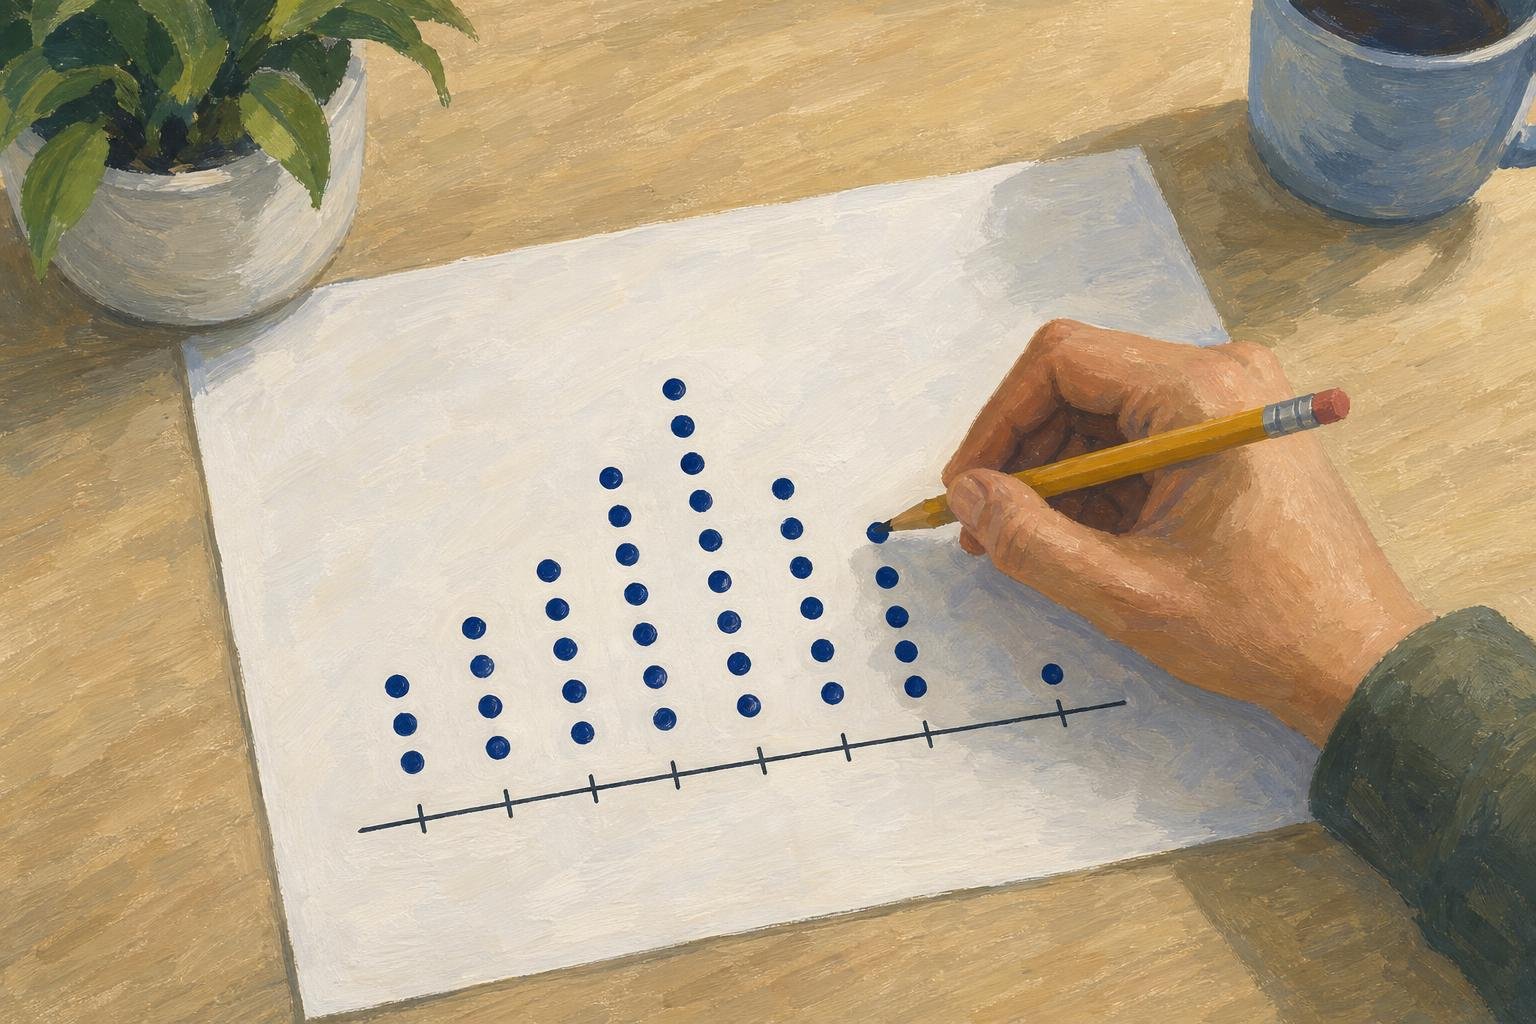

A dot plot shows numerical observations as dots above a number line, stacking repeated values so you can see each observation instead of only a bar’s total. Choose it when the individual values matter: a stack lets you count responses without hiding them inside a solid shape. The same dots can reveal a common response and a less typical one at a glance.
In This Article
- What Each Dot Represents
- Read a Finished Example
- Build Your Own Plot
- Find the Center and Spread
- Choose the Right Chart for Your Data
- Recognize Other Charts That Use Dots
- Key Takeaways
- Frequently Asked Questions
- Start With One Verified Dataset
What Each Dot Represents
In this frequency display, one dot represents one observation. If three students report the same study time, their responses form a three-dot stack. The horizontal position answers “What value?” and the stack answers “How many?”
Those positions need a trustworthy scale. Read the title and units first, then consider this badly drawn number line:
1────2────5
It makes the difference between 1 and 2 look identical to the difference between 2 and 5. Equal spaces must mean equal numerical differences. Otherwise, even correctly counted dots tell a distorted story about how far apart the values are.
Read a Finished Example
Consider a constructed classroom dataset recording study time in hours:
1, 2, 3, 3, 4, 4, 4, 5, 5, 5, 5
The finished chart places each response above its value. Rows provide room for stacking; they do not represent separate groups of students or additional hours.
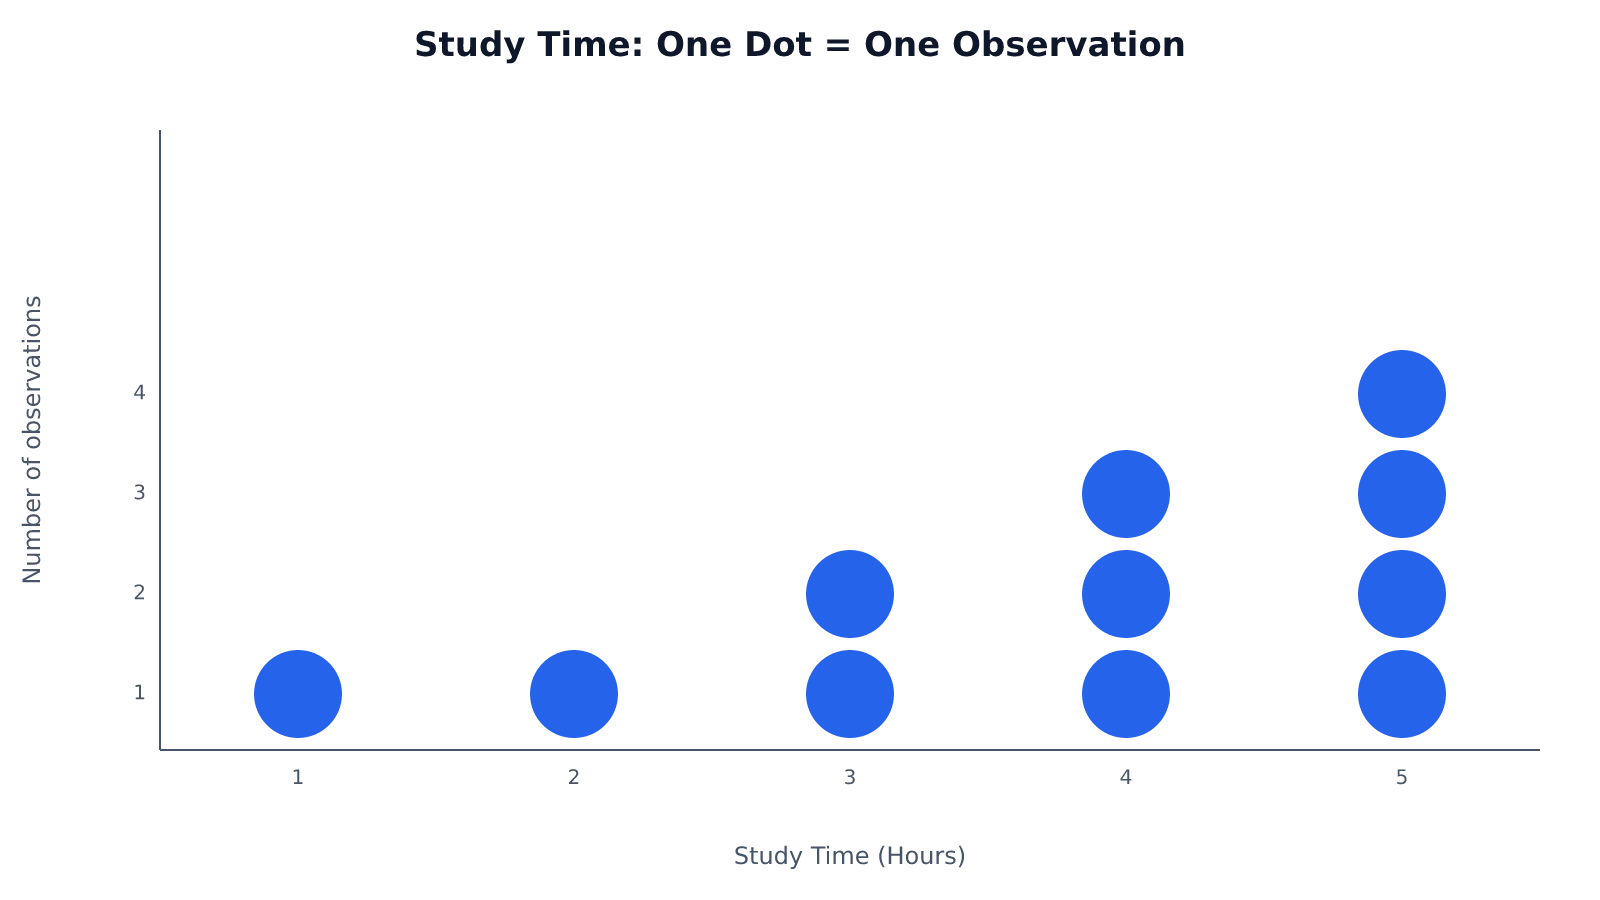
Count the dots in each stack, then add the counts to find the total number of observations. The responses cluster toward the higher end of the scale. Every labeled position has a response; there are no gaps across this scale.
Build Your Own Plot
To recreate that chart, sort the recorded observations so repeated entries sit together. Sorting changes their order, not their values. Cross off each entry as you plot it if that helps you avoid plotting a response twice.
Before adding dots, repair the compressed scale shown earlier. A whole-hour scale from 1 through 5 needs the intervening positions:
1────2────3────4────5
Whole-hour positions suit these observations. Measurements recorded to the nearest half hour would need positions for those halves; preserve that precision in your dot plot data.
Place a dot above each value and stack repeats with consistent spacing. Use equally sized dots so one response does not appear more important than another. Compare each stack with its entries, then count the whole chart.
Find the Center and Spread
The tallest stack gives the mode: 5 hours. With 11 observations, the median is the sixth response in the ordered list: 4 hours. The most common response and the middle response therefore differ. For an even number of observations, find the median by averaging the two middle values.
The mean uses every response. Multiply each value by its frequency and add the products: (1 × 1) + (2 × 1) + (3 × 2) + (4 × 3) + (5 × 4) = 41 hours. Divide by the 11 responses: 41 ÷ 11 ≈ 3.73 hours. Here, the mean, median, and mode are approximately 3.73, 4, and 5 hours, respectively.
The range measures spread between the endpoints: 5 − 1 = 4 hours. Yet that same range can describe either of these five-dot datasets:
A
●           ●
●     ●     ●
1  2  3  4  5

B
      ●
      ●
●     ●     ●
1  2  3  4  5
A contains 1, 1, 3, 5, 5; B contains 1, 3, 3, 3, 5. Both span four hours. A puts four responses at the endpoints, while B puts three in the middle. The range cannot distinguish them; the dots can.
Choose the Right Chart for Your Data
Use dot plots when readers need individual numerical values and can still distinguish the observations. The classroom chart makes exact counting practical. There is no universal size cutoff: repeated values build taller stacks, while closely spaced values compete for horizontal room.
For a hypothetical payroll dataset containing thousands of salaries, individual dots could bury the useful comparison. A histogram could group salaries into pay intervals, showing where employees concentrate. You would lose each person’s exact salary, but gain a readable view of the distribution. Bin boundaries affect that view, so choose intervals that serve the comparison.
The table separates that tradeoff from two other reasons to use dots: separating overlapping observations and comparing categories.
| Display option | How values and frequency appear | Best for | Main advantage | Main limitation |
|---|---|---|---|---|
| Stacked dot plot | For values 2, 2, 3, 5: two dots at 2, one at 3, one at 5; stack height = count. | Small numerical datasets with repeated values | Preserves individual values and shows exact frequencies. | Many repeats create tall stacks; nearby values can crowd together. |
| Strip plot with jitter | For values 2, 2, 3, 5: four dots at their numerical positions, offset perpendicular to the value axis. | Individual numerical observations with overlapping values | Offsets separate repeated observations without changing their values on the measurement axis. | Offset height does not encode frequency; dense clusters are hard to count. |
| Histogram | For values 2, 2, 3, 5: bins 2–<4 and 4–<6 have counts 3 and 1 on a count axis. | Numerical distributions that become crowded as individual dots | Groups observations into intervals to reveal broader distribution patterns. | Exact values within each bin are hidden; bin boundaries affect appearance. |
| Category-based dot chart (Cleveland) | One dot per category shows a value, such as median rent: North $1,200; South $1,500. | Comparing numerical measures across named categories | Dot position supports direct comparisons on a shared numerical scale. | Dot count is not observation frequency; within-category distributions are hidden. |
A shared numerical scale only helps when differences mean something. Apartment numbers are identifiers, not quantities: the distance between apartment 2 and apartment 5 is not a measurement of the apartments.
Recognize Other Charts That Use Dots
A Cleveland dot chart uses the category comparison shown in the table. A service desk’s average wait time, for example, would get one dot beside that desk’s name. Moving along the numerical axis means a longer or shorter wait, not more observations.
The Federal Reserve’s dot plot instead appears in its Summary of Economic Projections. It records Federal Open Market Committee participants’ assessments of appropriate monetary policy through federal funds rate projections for specified year-ends and the longer run.
Those projections can change market expectations. In the Federal Reserve’s June 16, 2021 projections, the median indicated two quarter-point rate increases by the end of 2023, compared with none in March. Reuters reported that U.S. Treasury yields rose that day as investors reacted to the shift toward earlier tightening.
The market use is forward-looking: investors compare the projected rate path with what they previously expected. The dots remain individual assessments, not an agreed schedule, and the published chart does not identify participants by name.
Key Takeaways
- Keep individual dots when exact observations matter to the comparison.
- Use the classroom example’s differing centers to distinguish a typical response from a calculated average.
- Compare the five-dot examples before assuming equal ranges mean similar distributions.
- Choose grouped intervals when individual marks obscure the pattern.
- Read Fed projections as policy expectations, not recorded study-time-style observations.
Frequently Asked Questions
What Is a Dot Plot?
A dot plot marks values with dots; in a stacked frequency version, each dot represents an observation. The important distinction is whether the marks represent individual records or category summaries, as in the Cleveland chart.
What Does the Fed Dot Plot Show?
The Fed dot plot shows policymakers’ individual projections of an appropriate federal funds rate for the periods displayed. A shift in those projections signals changed assessments, not a binding commitment to future decisions.
What Does a Dot Plot Look Like?
A stacked dot plot looks like columns of dots above numerical positions, with taller columns indicating more observations. If the chart instead has named categories beside individual dots, use their positions to compare category values, not their number to count responses.
Can One Chart Have Two Equally Common Values?
Yes, exactly two values tied for the highest frequency give a dataset two modes, called bimodal. Two equally tall stacks qualify only when no other stack is taller.
Does an Empty Position on the Scale Mean the Data Is Missing?
No, an empty position usually means no recorded observation has that value. Missing data means an observation was not recorded or is unavailable; the gap alone cannot establish that.
Start With One Verified Dataset
Before sharing your first chart, check that its title identifies the observations, its axis states the unit, and equal numerical differences occupy equal spaces. Then compare each stack with the source data and confirm the total dot count. For the study-time example, the stacks should contain 1, 1, 2, 3, and 4 dots at 1 through 5 hours, respectively: 11 observations in all.
Recommended for you

The Visual Language of Books: How Covers Communicate Complexity
At thumbnail size—often 100–160 pixels wide on retail grids—a cover must communicate genre, tone, and complexity before a reader can zoom in. The difference between a muddled thumbnail and a crisp focal point can determine whether a title gets a click, a pickup, or a pass. If you want a practical method for turning ideas […]

Deep Reading in a Digital World: Stay Focused in an Age of Distraction
Your attention is outnumbered: surveys put daily phone pickups in the 50–150 range and notifications in the dozens, while a single interruption can cost several minutes to regain depth. If you want Deep Reading in a Digital World: How to Stay Focused in the Age of Distraction, you need a deliberate method, not willpower. This […]
Logarithmic Graph: Equal Ratios, Not Equal Differences
A logarithmic graph spaces 10–100 like 100–1,000. Separate log axes from log functions, read values, and plot curves with confidence. See how it works.

Reading as Mental Design: How Books Shape the Way We Think
Flip open a book and you trigger a design studio in your head: eyes fixate for roughly 200–250 ms per word group, 10–15% of eye movements jump backward to verify links, and your working memory holds about four “chunks” while you assemble a model of what the text describes. Reading as a Form of Mental […]
Right vs Left Skewed Histogram: What the Tail Reveals
A right vs left skewed histogram is named for its tail, not its tallest bars. Avoid reversed readings and check averages and binning. Explore the guide.

How to become productive
You can’t outwork a broken system. Knowledge workers routinely lose 60–120 minutes a day to context switching, unclear priorities, and manual tasks that smart tools could finish in seconds. The fix is not more hours; it’s a compact operating system that aligns focus, energy, and technology. If your intent is to learn how to become […]
Bimodal Histogram: Two Peaks That One Average Can Hide
A bimodal histogram can reveal two operating conditions. Use the 15 and 25 millisecond test example to read the peaks and plan your next analysis. See how.
Bar Graph Scales: How Small Changes Look Much Bigger
A bar graph can make 35% to 39.6% look like a huge leap. Learn how scales and layouts shape comparisons, then build one from a small table. See the guide.