
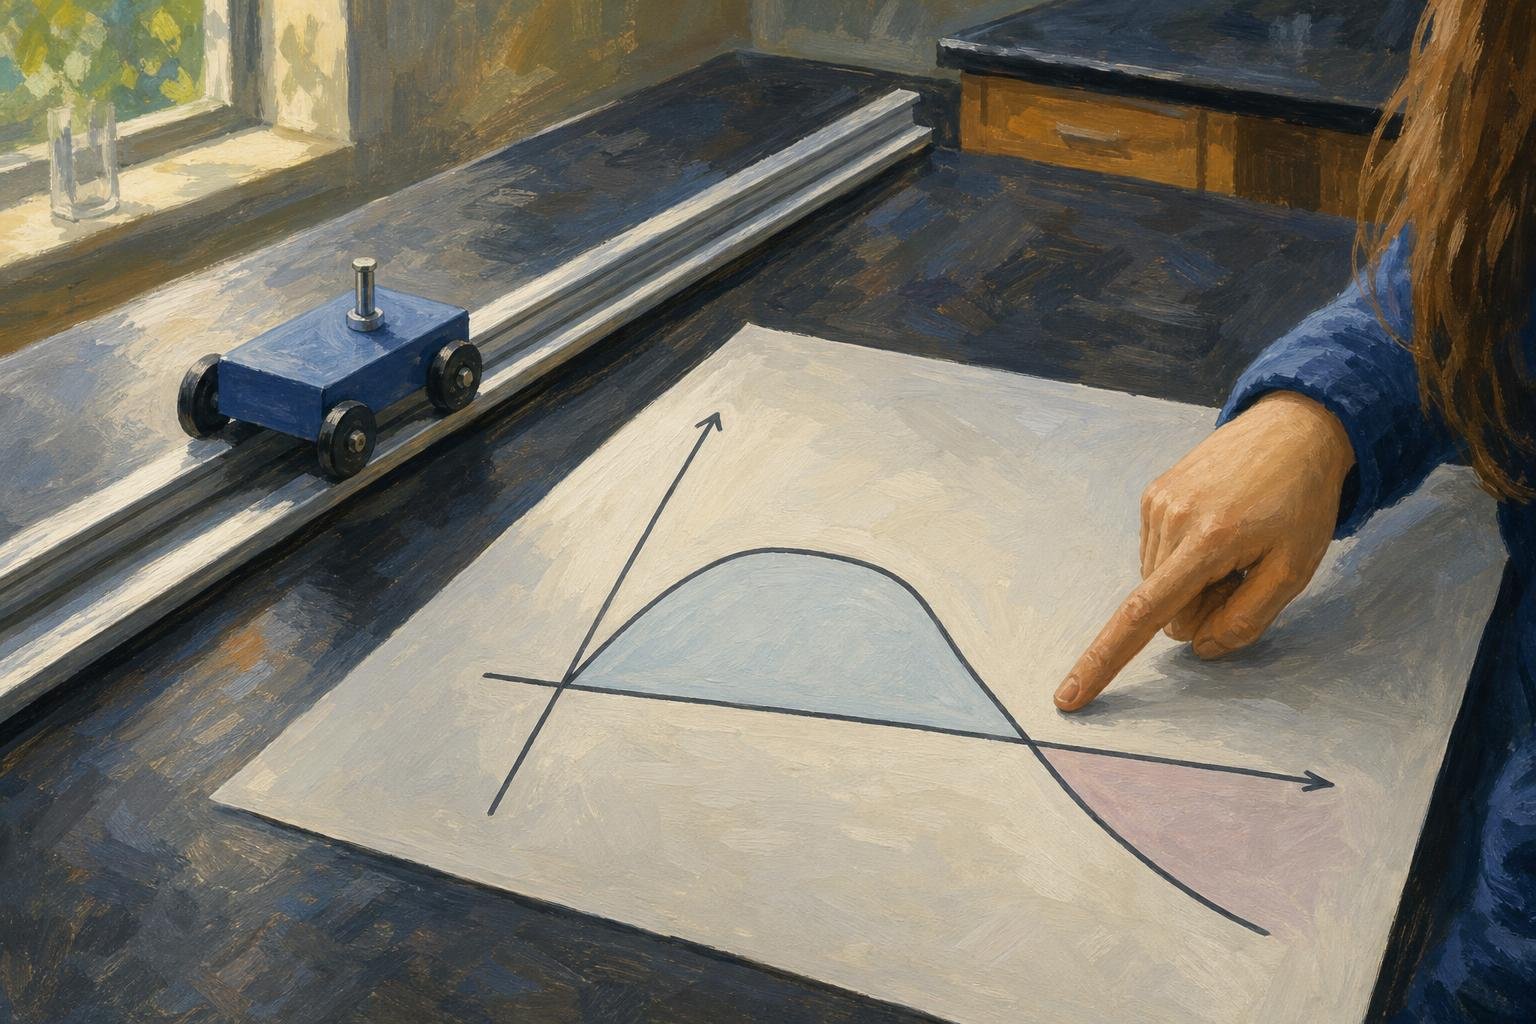

On a velocity vs time graph, a line rising from zero shows an object’s velocity increasing as time passes: a runner could be pushing away from the start. The line’s height gives velocity, its slope gives acceleration, and its signed area gives displacement. Follow the runner and a reversing cart below to connect those readings to motion.
In This Article
- Read the Axes and Choose a Positive Direction
- Read Flat and Sloping Segments
- Calculate Acceleration From the Slope
- Tell Speeding Up From Slowing Down
- Find Displacement From Area
- Separate Distance From Displacement
- Key Takeaways
- Frequently Asked Questions
- Read Motion From Shape and Sign
Read the Axes and Choose a Positive Direction
Time runs horizontally, usually in seconds; velocity runs vertically, with SI units of meters per second (m/s). To read a velocity versus time graph, first choose a positive direction. For a cart on a track, let right be positive: +3 m/s means rightward motion.
Now suppose the cart brakes, stops, and rolls left at −3 m/s. Its graph reaches zero before dropping below the time axis. The cart has reversed direction, yet its final speed equals its earlier speed: 3 m/s. Speed is velocity’s magnitude, without the directional sign.
Read Flat and Sloping Segments
A runner’s velocity increases during the first 4 seconds, holds steady from 4 to 7 seconds, and decreases from 7 to 10 seconds. The line rises, levels off, then falls. During that last interval, suppose the runner keeps moving forward: shorter distances covered each second show the runner slowing down.
The steady middle interval is the flat line you would see on a constant speed graph for motion in one direction. Away from zero, the runner keeps moving; on the time axis, the runner rests. These intervals describe different phases, not one unchanging acceleration throughout the run.
Calculate Acceleration From the Slope
Give the opening surge some numbers: the runner goes from 0 to 8 m/s in 4 seconds. Average acceleration measures that velocity change over the elapsed time:
Average acceleration = (final velocity − initial velocity) ÷ elapsed time
Here, (8 − 0) ÷ 4 = 2 m/s². If the segment is straight, velocity increases by 2 m/s each second: the acceleration is constant. The runner gains the same amount of velocity with each passing second.
A curved line describes a different surge. Calculate Δv/Δt between two points on the curve for average acceleration across an interval. For instantaneous acceleration, draw a tangent, a straight line matching the curve’s slope, at the chosen instant. Choose two readable points on that tangent, not two points on the curve, and calculate Δv/Δt. Where the curve grows steeper, acceleration’s magnitude grows. The runner’s gains are no longer even.
Tell Speeding Up From Slowing Down
A downward slope can describe a cart gaining speed. If its velocity changes from −2 to −6 m/s, it is moving left faster: speed rises from 2 to 6 m/s. On a negative velocity graph, moving farther below zero means moving faster in the negative direction.
Compare the signs: matching velocity and acceleration signs mean speeding up; opposite signs mean slowing down. The table puts each combination beside a concrete change over the same interval.
| Velocity–acceleration sign case | Velocity graph position | Graph slope (acceleration) | Velocity change over 2 s | Speed change and result |
|---|---|---|---|---|
| Positive velocity, positive acceleration | Above the time axis: v > 0 | Upward: a = +2 m/s² | +2 → +6 m/s | 2 → 6 m/s: speeding up |
| Positive velocity, negative acceleration | Above the time axis: v > 0 | Downward: a = −2 m/s² | +6 → +2 m/s | 6 → 2 m/s: slowing down |
| Negative velocity, negative acceleration | Below the time axis: v < 0 | Downward: a = −2 m/s² | −3 → −7 m/s | 3 → 7 m/s: speeding up |
| Negative velocity, positive acceleration | Below the time axis: v < 0 | Upward: a = +2 m/s² | −7 → −3 m/s | 7 → 3 m/s: slowing down |
At an axis crossing, read the intervals on either side separately: approaching zero and leaving zero have different effects on speed.
Find Displacement From Area
Speed tells you how fast the runner moves; displacement tells you the change in position. Calculate it from the signed area between the velocity line and the time axis. Above the axis contributes positively, below it negatively. Multiplying m/s by seconds gives meters.
For a rectangle, use vΔt, where Δt is elapsed time. If a finish line lies that displacement ahead, that steady run reaches it at the interval’s end.
The runner could instead increase velocity steadily from zero to 6 m/s over 4 s. That triangular area is ½ × base × height, or ½ × 4 × 6 = 12 m. Split more complicated shapes into regions and keep each region’s sign.
Separate Distance From Displacement
Keeping those signs lets outward and return travel cancel. A cart moving at +4 m/s for 2 s, then −2 m/s for 4 s, produces areas of +8 m and −8 m. Add signed areas for displacement; add their magnitudes for total distance.
For a sloping segment that crosses zero, split the area at the crossing before adding magnitudes. Otherwise, cancellation hides part of the journey. The returning cart makes the distinction concrete: displacement = +8 + (−8) = 0 m, while total distance = |+8| + |−8| = 16 m.
Key Takeaways
- Establish the positive direction before describing the motion.
- Divide the graph into intervals where the behavior changes.
- Pair each slope with the velocity’s sign before calling the motion faster or slower.
- Decide whether the question needs signed area or total area magnitude.
Frequently Asked Questions
These questions address readings that can look contradictory, especially at zero or below the axis.
What Is the Difference Between a Velocity Graph and a Time Graph?
A velocity graph names velocity as a plotted quantity, while a time graph names time; neither label alone specifies both axes. Time could be paired with position, velocity, or acceleration. Read both axis labels to establish the relationship.
Does a Horizontal Line Below the Time Axis Mean the Object Is Stopped?
A horizontal line below the time axis means steady motion in the negative direction, not rest. At −5 m/s, the object covers 5 meters each second toward the chosen negative direction.
Can an Object Have Zero Velocity While Its Acceleration Is Nonzero?
An object can have zero velocity and nonzero acceleration at the same instant. A ball thrown straight upward has zero vertical velocity at its highest point while gravity still accelerates it downward. That momentary stop differs from remaining at rest over an interval.
Does a Steeper Downward Slope Always Mean the Object Is Slowing Down?
A steeper downward slope does not always mean slowing down; it means a greater magnitude of negative acceleration. Its effect on speed depends on which side of zero the velocity occupies.
Does Negative Velocity Tell You Which Side of the Starting Point an Object Occupies?
Negative velocity tells you direction of motion, not which side of the starting point the object occupies. A cart can be heading back while still on the positive side of its start. Its accumulated signed area gives its position relative to that start.
Read Motion From Shape and Sign
Test your reading with the runner’s flat segment: from 4 to 7 s, velocity stays at 8 m/s. Its acceleration is zero, but its displacement is 8 × (7 − 4) = 24 m. A flat velocity line therefore does not mean zero displacement.
Recommended for you

Area Chart Fill: Separate Values or a Shared Total?
An area chart uses fill to emphasize magnitude, but stacked and separate values mean different things. See the distinctions and learn how to build one in Excel.

Line Graph Scales: Why the Same Data Can Look Different
A line graph can exaggerate a modest change. Learn to check axes, read a five-month sales example and build clearer charts from your data. Explore the article.

Right vs Left Skewed Histogram: What the Tail Reveals
A right vs left skewed histogram is named for its tail, not its tallest bars. Avoid reversed readings and check averages and binning. Explore the guide.
Domain and Range of a Graph: Which Endpoints Count?
Read the domain and range of a graph by checking each axis, endpoints, gaps, and turning points. Get the notation right—see the step-by-step explanation.

Mental Health Infographic: 8 Ideas With Text Previews
Turn a mental health infographic into a clear visual and useful next step, from a warning-sign calendar to support options. Explore eight adaptable ideas.
Frequency Histogram: Every Bar Traced to Its Scores
A frequency histogram shows how common scores are, not how high. Check interval boundaries, trace bars to scores, and avoid misreading the chart. See how.

Stem and Leaf Plot: Ordered Data, Every Value Visible
A stem and leaf plot keeps each value visible while sorting reading times into rows. Learn to build one, find the middle, and spot patterns. See how it works.

Stacked Bar Chart: Totals, Parts, and Shares Made Clear
A stacked bar chart shows totals and the parts behind them. Learn when to use counts or percentages, with a worked example and Excel steps. See the guide.