


Recommended for you
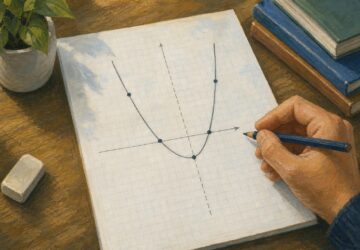
Quadratic Graph: One Worked Example, From Curve to Roots
Plot a quadratic graph using its vertex, symmetry and intercepts. Follow one worked example, explore shifts and recover an equation. See the key steps.

Climate Change Infographic: From Emissions to Action
See how a climate change infographic links heat-trapping gases to rising heat, then separates emissions cuts from adaptation. Explore the causes and actions.

Mental Health Infographic: 8 Ideas With Text Previews
Turn a mental health infographic into a clear visual and useful next step, from a warning-sign calendar to support options. Explore eight adaptable ideas.

The Future of Reading: How AI Changes Book Discovery and Enjoyment
Libraries logged hundreds of millions of digital book checkouts last year, while neural text-to-speech can now produce a clean, hour-long audiobook in minutes. Meanwhile, recommendation models trained on billions of reading interactions quietly shape what appears in your “Because you liked…” rows. The future of reading is no longer just about pages and covers; it’s […]

Turning Data into Stories: The Psychology of Visual Complexity
A network map with 1,200 nodes feels mesmerizing until your eyes start to swim; a five-bar chart can feel banal yet instantly graspable. The gap between awe and overload is not just taste—it’s how our visual and cognitive systems negotiate complexity, novelty, and control. If you want to use complex visuals to create connection and […]

Stem and Leaf Plot: Ordered Data, Every Value Visible
A stem and leaf plot keeps each value visible while sorting reading times into rows. Learn to build one, find the middle, and spot patterns. See how it works.

The Visual Language of Books: How Covers Communicate Complexity
At thumbnail size—often 100–160 pixels wide on retail grids—a cover must communicate genre, tone, and complexity before a reader can zoom in. The difference between a muddled thumbnail and a crisp focal point can determine whether a title gets a click, a pickup, or a pass. If you want a practical method for turning ideas […]

A Circle Graph’s Largest Slice Isn’t Always a Majority
Read a circle graph without mistaking the largest slice for a majority. Follow a 40-student survey from counts to percentages and angles. See how it works.