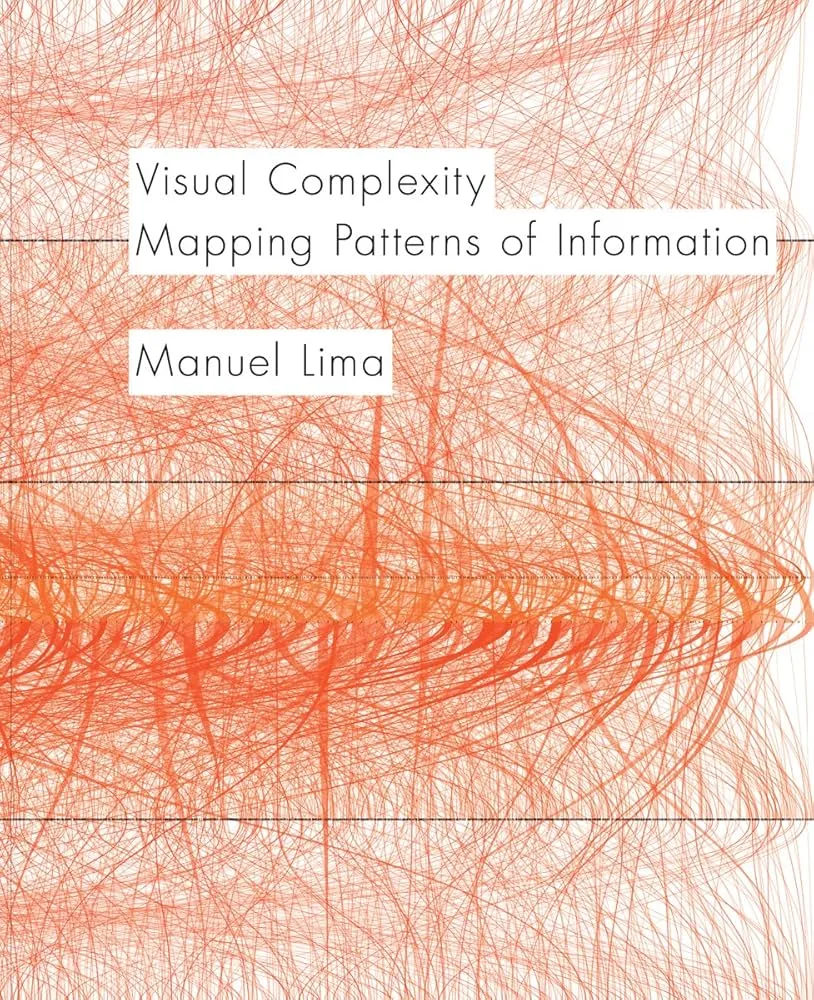
Visual Complexity: Mapping Patterns of Information Review
Visual Complexity by Manuel Lima is a tour of network visualization: how to map connections in science, culture, technology, and society with clarity and restraint. It is a history, a pattern library, and a critique of when links illuminate and when they overwhelm.
Overview
Lima assembles hundreds of diagrams that chart relationships: force-directed graphs, arc and chord diagrams, adjacency matrices, hive plots, edge-bundled maps, radial networks, flow maps, and hybrid layouts. Short essays frame theory, perception limits, and design ethics: legibility first, spectacle second.
Summary
Chapters track the evolution from early social and biological graphs to contemporary web, transport, citation, and cultural maps. Lima contrasts trees with networks and explains why hierarchy breaks when cross-links dominate. He discusses layout mechanics, encoding choices for node and edge attributes, labeling strategies, and interaction—filtering, focus+context, and animation. Case studies expose common traps: hairball density, misleading color, and decorative edges that add nothing.
Authors
Manuel Lima writes as a designer–historian with an engineer’s respect for constraints. Commentary is concise, source-aware, and focused on practice.
Key Themes
Structure over ornament; choose encodings that match questions; balance aesthetics with measurement; interaction as part of readability; honesty about uncertainty and missing data.
Strengths and Weaknesses
Strengths: breadth of examples, crisp design guidance, and a durable vocabulary for discussing networks. Weaknesses: limited step-by-step implementation detail and light statistics on inference from graphs. Treat it as a field guide, not a coding manual.
Target Audience
Information designers, data journalists, researchers, product teams, and students who need precedents and principles for mapping relationships.
Favorite Ideas
Adjacency matrices for dense graphs; edge bundling to reveal routes without clutter; small multiples to compare network states over time; radial layouts for hub–spoke stories; labels planned before layout, not after.
Takeaways
Start with the question, pick a layout that serves it, and constrain encodings. Prototype alternatives—matrix vs node–link—and choose what readers parse faster. Build legends and interaction that reduce cognitive load. Elegance is earned by clarity, not by extra lines.

