The Book of Trees: Visualizing Branches of Knowledge Review
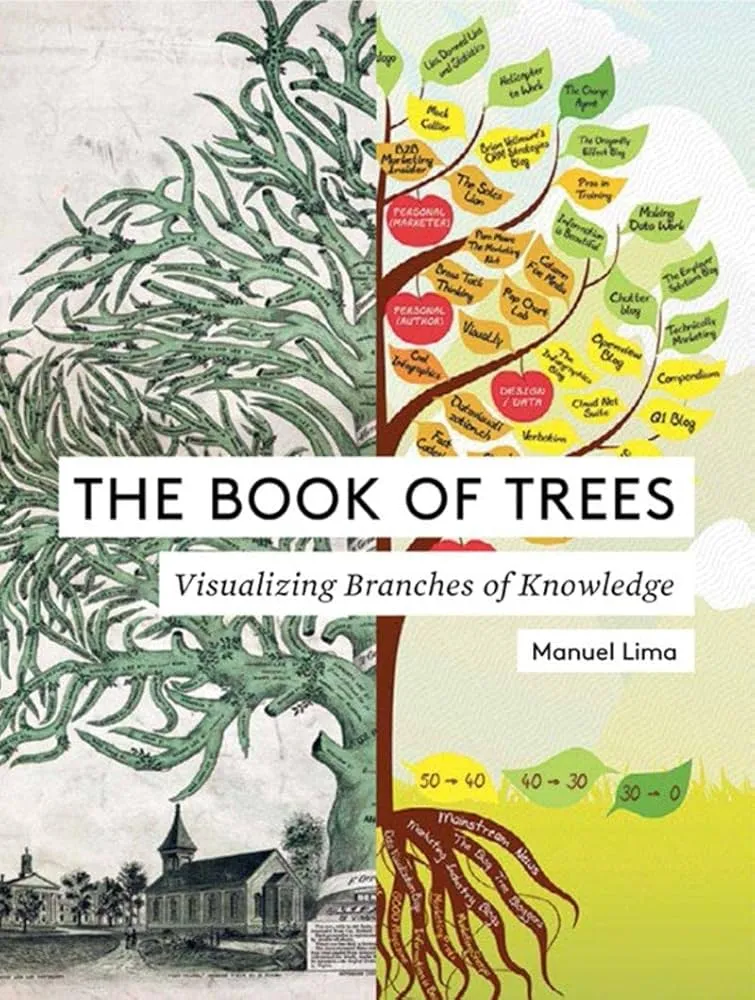
The Book of Trees by Manuel Lima is a visual history of how humans map ideas with arboreal metaphors: roots, trunks, branches, and leaves used to organize memory, belief, science, and data. It works as museum, pattern library, and caution against ornamental excess.
Overview
Lima surveys medieval genealogies, biblical and cosmological trees, Enlightenment taxonomies, evolutionary trees, mind maps, radial dendrograms, treemaps, icicles, sunbursts, and network–tree hybrids. Each plate includes authorship, date, purpose, and technique notes that translate to modern practice.
Summary
Chapters progress from symbolic and theological trees to scientific classification and contemporary information design. We see how “branching” solves hierarchy, how orientation shifts meaning, and how space-filling encodings trade purity for density. Case studies show trees as persuasion devices and as analytic tools, with design tactics for label placement, edge routing, and balance between structure and story.
Authors
Manuel Lima writes as a designer–historian. Commentary is concise, iconography-aware, and focused on what makes a tree legible or misleading.
Key Themes
Hierarchy as a cognitive scaffold; metaphor as interface; trade-offs among radial, vertical, and space-filling layouts; convergence between trees and networks when real worlds are not strictly hierarchical.
Strengths and Weaknesses
Strengths: wide historical range, high production quality, and practical notes that inform present-day taxonomy and UI work. Weaknesses: limited step-by-step methods and sparse statistical discussion on when non-hierarchical data break tree assumptions. Treat it as precedent map, then prototype.
Target Audience
Information designers, data journalists, UX architects, educators, and anyone building taxonomies, site maps, org charts, or evolutionary visuals.
Favorite Ideas
Treemap for dense part-to-whole with hierarchy; sunburst and icicle for readable depth; radial dendrograms for symmetry when labels permit; hybrid tree–graph layouts where cross-links matter.
Takeaways
Pick tree forms to match data and task. If hierarchy is real and labels are short, radial layouts shine; for large datasets, consider treemaps or icicles; when cross-links dominate, pivot to networks. Design labels first, test readability, and let metaphor serve meaning, not decoration.