The Book of Circles: Visualizing Spheres of Knowledge Review
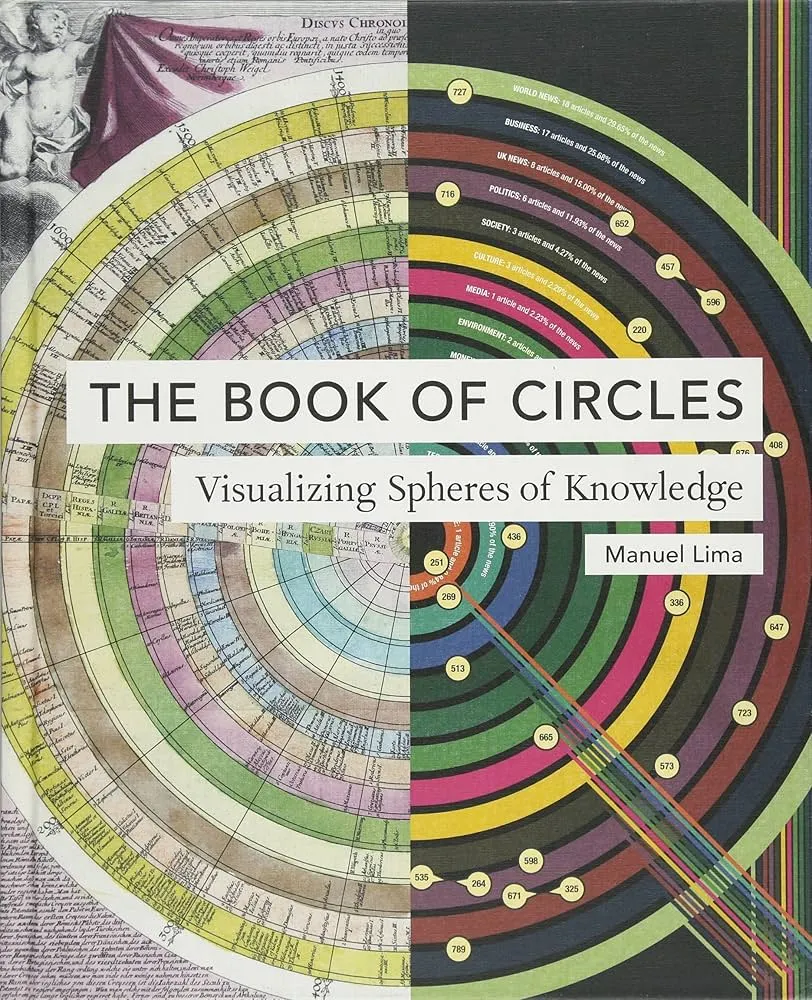
The Book of Circles by Manuel Lima is a curated atlas of circular diagrams across science, culture, and design. It shows why circles endure: symmetry aids perception, enclosure organizes complexity, and rotation encodes cycles. The book is part history, part pattern library, part critique of when radial form clarifies or obscures.
Overview
Lima assembles cosmograms, calendars, mandalas, polar plots, coxcomb charts, chord and sunburst diagrams, radial trees, target maps, and circular timelines. Each entry pairs an image with concise context: maker, purpose, era, technique. Short essays explain perceptual trade-offs—angle, arc length, area—and how labels, hierarchy, and interaction affect readability.
Summary
Examples are grouped by function: mapping space and heavens; measuring time and seasonality; classifying knowledge and genealogy; showing flow, proportion, and connectivity; staging argument and belief. Historical artifacts sit beside contemporary data graphics, revealing recurring solutions: center as anchor, rings as time or rank, spokes as categories, perimeter as narrative. Lima highlights pitfalls—crowded centers, illegible arcs, decorative excess—then shows corrective patterns such as ring spacing, radial grids, and disciplined labeling.
Authors
Manuel Lima writes as a designer–historian. Commentary is economical, image-led, and attentive to craft without slipping into mystique.
Key Themes
Cycle and recurrence; hierarchy around a hub; enclosure as cognitive scaffold; symmetry as both aid and temptation; the circle as a cross-cultural interface from astronomy to argumentation.
Strengths and Weaknesses
Strengths: breadth across eras and domains, high production quality, and actionable notes that translate into practice. Weaknesses: limited step-by-step construction guidance and light statistical critique of when radial encodings underperform bars or lines. Treat it as a sourcebook, not a manual.
Target Audience
Information designers, data journalists, educators, museum and product teams, and anyone seeking precedents for cyclical, hierarchical, or hub-and-spoke data.
Favorite Ideas
Sunburst for hierarchical depth with compact footprint; polar plots for periodic data; chord diagrams to reveal bidirectional ties; circular timelines that turn chronology into a visible cycle.
Takeaways
Choose circles when the concept is cyclical, centralized, or radiating from a core. Plan labels first, control ring density, and check comparisons that rely on angles or areas. Let symmetry serve meaning, not decoration: when in doubt, prototype a Cartesian alternative and pick the one readers can parse faster.