


Recommended for you
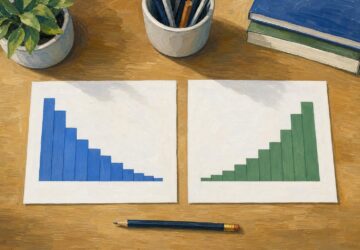
Right vs Left Skewed Histogram: What the Tail Reveals
A right vs left skewed histogram is named for its tail, not its tallest bars. Avoid reversed readings and check averages and binning. Explore the guide.
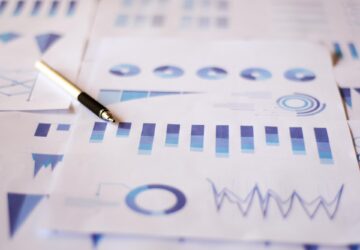
Infographic Ideas That Answer Real Everyday Questions
Find infographic ideas for report findings, customer questions, budgets, and more. Match each question to a clear visual structure—explore the examples.
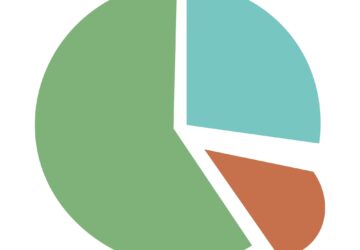
Pie Chart Examples: The Dollar Totals Behind Each Slice
Use pie chart examples with a $4,000 budget and $100,000 in sales to connect slices to dollars, calculate shares, and compare totals. See the calculations.
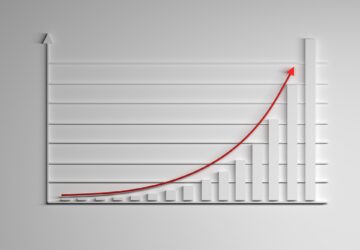
Exponential Graph: Fixed Multipliers, Curved Results
An exponential graph multiplies outputs at equal input steps. Use points and the y=0 asymptote to sketch growth and decay curves. See the plotting steps.
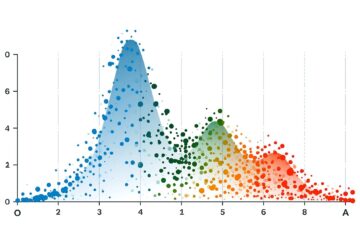
Bimodal Histogram: Two Peaks That One Average Can Hide
A bimodal histogram can reveal two operating conditions. Use the 15 and 25 millisecond test example to read the peaks and plan your next analysis. See how.
Line Graph Scales: Why the Same Data Can Look Different
A line graph can exaggerate a modest change. Learn to check axes, read a five-month sales example and build clearer charts from your data. Explore the article.

The Future of Reading: How AI Changes Book Discovery and Enjoyment
Libraries logged hundreds of millions of digital book checkouts last year, while neural text-to-speech can now produce a clean, hour-long audiobook in minutes. Meanwhile, recommendation models trained on billions of reading interactions quietly shape what appears in your “Because you liked…” rows. The future of reading is no longer just about pages and covers; it’s […]

How to Find a Hobby That Truly Fits You
Give a hobby 21 days and 90 minutes per week, and you will learn more about your motivation, stress triggers, and attention than a dozen personality quizzes. A few concrete moves—testing a novel, a 5‑aside game, or a few low-stakes rounds of online gameplay—can reveal which activities calm your nervous system, sharpen focus, and actually […]